How to Create and Automate Google Ad Reports with Templates|Detailed explanation of report types and required fields.
In this article, we provide a clear explanation for those who want to efficiently create Google Ad Reports. We cover essential points to consider in Google Ad Reports, how to create reports using the management interface, and methods to automate Google Ad Reports.
Additionally, we introduce a handy Google Ad Report template. If you have limited time for report-related tasks, please make use of it. With the convenient Looker Studio (formerly Data Studio), you can easily create understandable Google Ad Reports like the ones described below.
Popular Template: A Google Ad Report Template Popular for Reporting to Clients and Within Organizations
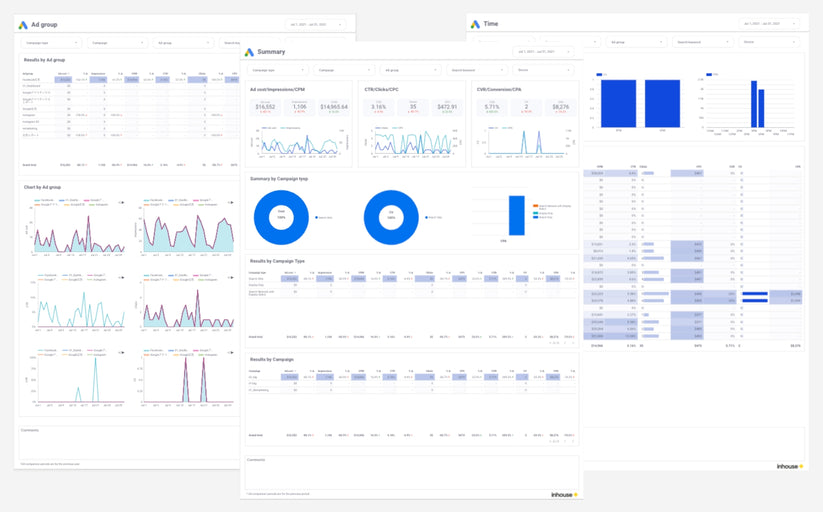
Quote: Google Ads report template[4003]
Demo Report
Report detail
Key Points to Cover in Google Ad Reports
Although the specific items included in a Google Ad Report naturally vary according to each company's objectives and strategies for Google Ads, there are common points that everyone should check. In this section, we will explain these points, dividing them by types of reports and their respective items.
Types of Google Ad Reports
- Summary Report: Compiles key metrics on a single page to review the overall picture.
- Monthly report: Examines how each KPI has trended month by month. While operation-type advertising tends to be shortsighted, having a monthly report allows for a constant overview of the current situation.
- Daily Report: Reviews the daily progression of each KPI. It allows for a detailed examination of how various KPIs change before and after implementing strategies.
- Campaign Report: Checks the performance of each campaign.
- Ad Group Report: Assesses the performance of each ad group.
- Search Keyword Report: Evaluates the performance of each bidding keyword.
- Search Query Report: Reviews the performance based on the actual search queries entered by users.
- Final Page URL Report: Analyzes the performance of each landing page.
- User Report: Examines the performance based on user demographics, such as region, age, and gender.
- Device Report: Assesses performance across different devices.
- Regional Report: Evaluates performance based on user attributes like region, age, and gender.
- Time of day report: Reviews performance based on different times of the day.
- Creative Report: For search, evaluates the performance of each ad copy; for display, assesses the performance of each banner creative.
- Placement Report: Analyzes the performance based on the sites where display ads appeared.
Key KPI Metrics to Include as Essential Elements in Google Ad Reports
Ensure that each report covers the following metrics.
Cost
This refers to the advertising expenses incurred. If an advertising agency is managing the campaign, it's important to agree in advance whether this cost will include the management fees.
Impressions
This is the number of times an advertisement is displayed to users. Also known as impressions, this count increases each time your ad appears on a Google Network search results page or on other sites.
CPM (Cost Per Thousand Impressions)
This is the average cost to show an advertisement 1,000 times to users. It is calculated as Cost ÷ Number of Impressions × 1,000. For example, if the number of impressions is 10,000 and the cost is $365, the CPM is approximately $36.50.
CTR (Click-Through Rate)
This is the ratio of users who click on an ad out of all the times it's displayed. It is used to assess the effectiveness of the ad creative (like banners or text headlines). CTR is calculated as Number of Clicks ÷ Number of Impressions. For instance, if there are 1,000 impressions and 5 clicks, the CTR is 0.5%.
Number of Clicks
This represents the number of times users have clicked on the ad. For example, if the same user clicks on an ad twice, the number of clicks is two. Note that even if the same user clicks multiple times on one ad impression, only up to two clicks are counted for billing. Also, clicks deemed invalid by Google's system are not counted.
CPC (Cost Per Click)
This is the average cost to gain one click. It is calculated as Cost ÷ Number of Clicks. For example, if there are 100 clicks and the cost is $365, the CPC is approximately $3.65.
CVR (Conversion Rate)
This is the ratio of users who convert after clicking on an ad. It is calculated as Conversions ÷ Number of Clicks. For example, if there are 100 clicks and 2 conversions, the CVR is 2%.
Conversion
This is the number of user actions defined as conversions in the ad management interface after a user clicks (or views) an ad. Conversions can include various user actions like purchasing a product, making an inquiry, signing up for membership, or requesting materials. For e-commerce sites, setting a conversion value allows not only tracking the number of conversions but also the sales revenue.
CPA (Cost Per Acquisition)
This is the average cost to acquire one conversion. It is calculated as Cost ÷ Conversions. For example, if there are 5 conversions and the cost is $365, the CPA is approximately $73.
ROAS (Return On Ad Spend)
This metric shows how much revenue is generated for every dollar spent on advertising. For e-commerce sites with set conversion values, it is calculated as Conversion Value ÷ Cost. For example, if the conversion value is $5 million and the cost is $1 million, the ROAS is 500%.
Frequency of data updates
These items should suffice for most reports, but equally important is the frequency of updates. The key to improving Google Ads performance lies in continuously checking and refining based on daily data. Therefore, it's crucial to ensure that the data is updated every day.
How to create a report on the Google Ads Management page
How to Check Google Ad report
Using the predefined reports provided by Google allows you to create reports immediately without the need to set up everything from scratch, making it highly recommended for beginners. Additionally, if there are any excess or missing items, you can customize the predefined report by adjusting the items as needed."
1. Log in to Google Ads
2.Select "Report" in the upper right corner.

3.After selecting a predefined report (detailed analysis), select the type of report you want to create.
In this case, select Predefined Report > Period > Day.to create an example of a Daily Report.

We now have the following daily reports!

Basic Usage and Operation of Google Ad Reports
Customize the Items
f there are any excess or missing items in the report, it's possible to add or remove them. For example, in this case, 'Day of the Week' has been added.

Save the Customized Report
You can save custom predefined reports by selecting "Save As" at the top right corner.

Open a saved report
Select Reports > Reports from the upper right corner, and you will see the following screen with a list of saved reports.

Download report
Select "Download" in the top right corner to download the data in the next 9 formats.
.csv
Excel.csv
.tsv
.xml
.csv.gz
.xml.gz
.pdf
.png
Google Spreadsheet

In the example, I downloaded it in Google Spreadsheet format.

Send reports via email.
The reports you want to go through on a regular basis can be emailed to members with whom you want to share the report by selecting the recipient and frequency of sending the report in the "Schedule" section from the upper right corner.

How to Automate Google Ad Reports
When actually submitting Google Ad Reports to clients or within your organization, it's necessary to format the reports in a way that is easy for the reader to understand.
Downloading data from the management interface each time and creating reports can be a time-consuming process. Therefore, if you need to create reports regularly, it's advisable to automate this task.
In this section, we will introduce methods to automate Google Ad Reports and discuss the advantages and disadvantages of each approach.
Looker Studio (formerly Data Studio)
Looker Studio is a free report creation tool provided by Google, allowing users to connect to various data sources and create clear, fully automated reports. For those who need reports solely for Google Ads, Looker Studio is highly recommended.
Advantages
-
Ability to easily create free, user-friendly reports.
-
Automation of data updates through Google's free Google Ads connector.
Disadvantages
- While the operation is simple, creating a report from scratch can take a considerable amount of time.
- Connectors for web advertisements other than Google Ads (such as Facebook Ads or Yahoo Ads) are not available, requiring the need to build separate mechanisms for data acquisition.
Automate Your Reports Now with 88studio With the 88studio [One-Time Purchase Version] Google Ad Report Template (4003), you can complete your report in just 3 minutes.
(Related Article)
Complete Guide to Using Google Ads with Looker Studio (Formerly Data Studio) - Click Here
Google Ads Add-on for Google Sheets
The Google Ads add-on for Google Sheets is an extension that allows you to export Google Ads data to a spreadsheet for free. Before the advent of Looker Studio, it was a widely used method, but now more people are transitioning to Looker Studio, which is also free to use. Google also recommends using Looker Studio.
Advantages
- Ability to export Google Ads data to a spreadsheet.
Disadvantages
- It takes time to master the functionality.
- Inability to create charts, making it difficult to produce visually appealing reports.
- Slow loading times and general system instability.
Advertising Report Automation Tool
An ad report automation tool is a tool that automates reports from multiple advertising media. For those who need reports that span multiple web advertisements, an ad report automation tool is recommended.
Advantages
- Ability to automate reports from multiple advertising media.
Disadvantages
- It takes time to master the use of the tool.
- It incurs costs.
List of Convenient Google Ad Report Templates
The templates we're about to introduce are created using Looker Studio and the free Google Ads connector.
You can create your own by referring to the 'Complete Guide to Using Google Ads × Looker Studio (formerly Data Studio)', and if you think it's a waste of time to start from scratch, feel free to purchase a template and customize it as you see fit.
Summary Report
In addition to KPI summaries, you can view results by type of campaign (search, display, video, etc.) and by campaign.

Learn more about Google Ads report template.
Monthly Report
This is a monthly report where you can check the progress of each KPI from month to month. Although operational advertising tends to be short-sighted, the monthly report allows you to always have a bird's eye view of the current situation.By checking the numerical values detailed in the table, you can capture the global trend in the graph.
Learn more about Google Ads report template.
Daily Report
This is a daily report where you can check the daily progress of each KPI. You can check in detail how each KPI changed prior and after each measure. As with the Monthly Report, you can check detailed numerical values in a table while grasping overall trends in a chart.
Learn more about Google Ads report template.
Campaign Report
This is a campaign report that allows you to check the performance of each campaign,Since the highest tier in Google Ads is the campaign, you can first analyze the effectiveness of each campaign from a bird's eye view, and then dig deeper into the ad groups and keywords introduced next.
Learn more about Google Ads report template.
Ad Group Report
An ad group report that allows you to verify the performance of each ad group.
Learn more about Google Ads report template.
Keyword Report
A keyword report that allows you to check the performance of every keyword you bid.
Learn more about Google Ads report template.
Query Report
This search phrase report allows you to see performance by the search terms that users actually search for. Especially if you are using partial match (Broad) or phrase match (Phrase) match types, check to see if you are wasting money on less relevant search terms. If it does, exclude these search terms.
Learn more about Google Ads report template.
Final page URL Report
Final page URL report to check performance per final page URL (landing page).
Learn more about Google Ads report template.
User Report
User reports allows you to verify performance by age, gender, and other user attributes.
Learn more about Google Ads report template.
Device Report
Device report to check performance of the device.
Learn more about Google Ads report template.
Region Report
Regional reports allow you to see performance per region.
Learn more about Google Ads report template.
Time Report
Time of day report to check performance based on time of day.
Learn more about Google Ads report template.
FAQ
How to Display Costs Including Operational Fees
You can set advertising costs including commission using the 'calculated field' feature in Looker Studio.
a. Open the target data source and select "Add Field

b. Set each field as follows
- Field name: Ad cost
- Calculation formula (example): Cost*1.2 (to add 20% commission to the advertising cost)

How to set up conversions
How to make a choice between Conversions and All Conversions
You can select either of the following conversions. Please choose from the metrics dropdown menu
- Conversions (included in the 'Conversions' column of the ad management interface)
- All Conversions (included in the 'All Conversions' column of the ad management interface)

How to set up specific conversions
The free Google Ads Connector in Looker Studio (formerly Data Studio) does not allow you to choose individual conversion actions as indicators in Looker Studio (former Data Studio).So It is necessary to set up individual conversion actions, and you have to ask an engineer to get the data using the Google Ads API.
88studio report template to automate Google ad reports
88studio provides Google Ad reports for a variety of needs.
Google Ads report template
Simple Google ad report template with commission settings and commentary features for ad agencies.

Quote: Google Ads report template[4003]
Demo Report
Report detail
Over 2,000 companies use Looker Studio (former Data Portal) templates from 88studio
88studio offers a wide variety of customizable Looker Studio report templates to meet a variety of needs. If you want to automate report creation but find it difficult to create your own reports from scratch, use 88studio to make the most of your time.
Compatible with GA4, Search Console, and Google Ads. With a single purchase, you can create reports for an unlimited number of sites, copy reports in minutes, and customize them as you wish. Google Analytics expert Taku Ogawa is on board as an advisor to ensure that the templates are updated whenever there is a change in the GA4 specifications, so you can use it with peace of mind for years to come.
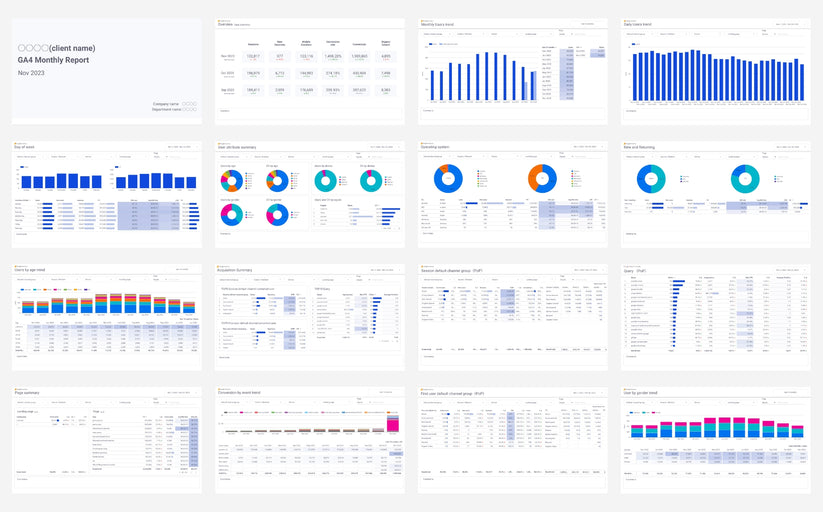
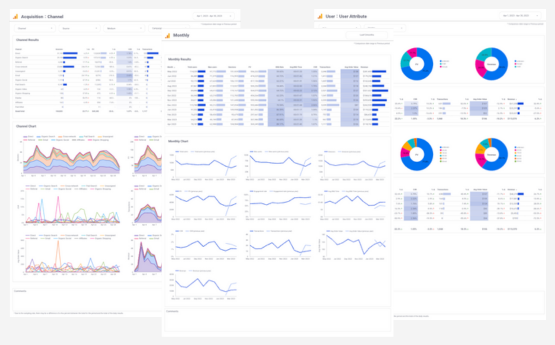
GA4 Monthly Report Template[4007]
This is a 61-page Looker Studio GA4 monthly report template that allows you to automate GA4 monthly reporting reports.
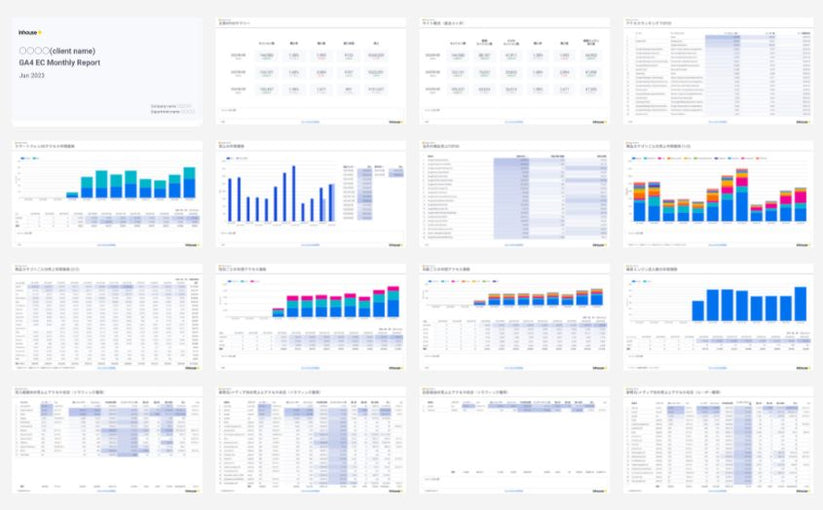
GA4 EC Monthly Report Template[4008]
This is a 61-page Looker Studio GA4 monthly report template that allows you to automate GA4 monthly reporting reports.
GA4 Standard Report Template[4004]
This is a versatile 18-page GA4 report template that allows anyone to easily automate reporting and streamline daily monitoring.
GA4 EC Standard Report Template[4012]
This is a 22-page universal GA4 report template for e-commerce sites that allows anyone to easily automate reporting for e-commerce sites and streamline daily monitoring.


![GA4 Summary Report Template[4013]](http://88studio.io/cdn/shop/files/4013thumbnail.png?v=1733209235&width=533)
![GA4 Monthly Report Template[4007]](http://88studio.io/cdn/shop/files/4007_GA4-monthly-report-firstview_80551e9b-22ec-47d9-a375-29691372a34f.jpg?v=1702969299&width=533)
![GA4 EC Monthly Report Template[4008]](http://88studio.io/cdn/shop/files/4008_75c0c108-4e41-4fee-87ec-e7c823b6939d.png?v=1743466274&width=533)
![GA4 Standard Report Template[4004]](http://88studio.io/cdn/shop/files/4004_f67fd549-68fe-46c3-b8bc-57b0cad056ee.png?v=1740969729&width=533)
![GA4 EC Standard Report Template[4012]](http://88studio.io/cdn/shop/files/4012v2.0.png?v=1745371761&width=533)
![Google Ads Report Template[4003]](http://88studio.io/cdn/shop/files/4003_v2_1.png?v=1737458695&width=533)
![SEO Standard Report Template [4002]](http://88studio.io/cdn/shop/files/4002v2.0.png?v=1747814286&width=533)
![GA4 EC Basic Dashboard Template[4010]](http://88studio.io/cdn/shop/files/4010v2.0.png?v=1745966967&width=533)
![SEO Monthly Report Template[4011]](http://88studio.io/cdn/shop/files/4011_v2.png?v=1737028939&width=533)
![GA4 Dashboard Template[4009]](http://88studio.io/cdn/shop/files/4009v2.0.png?v=1740388404&width=533)