Overview
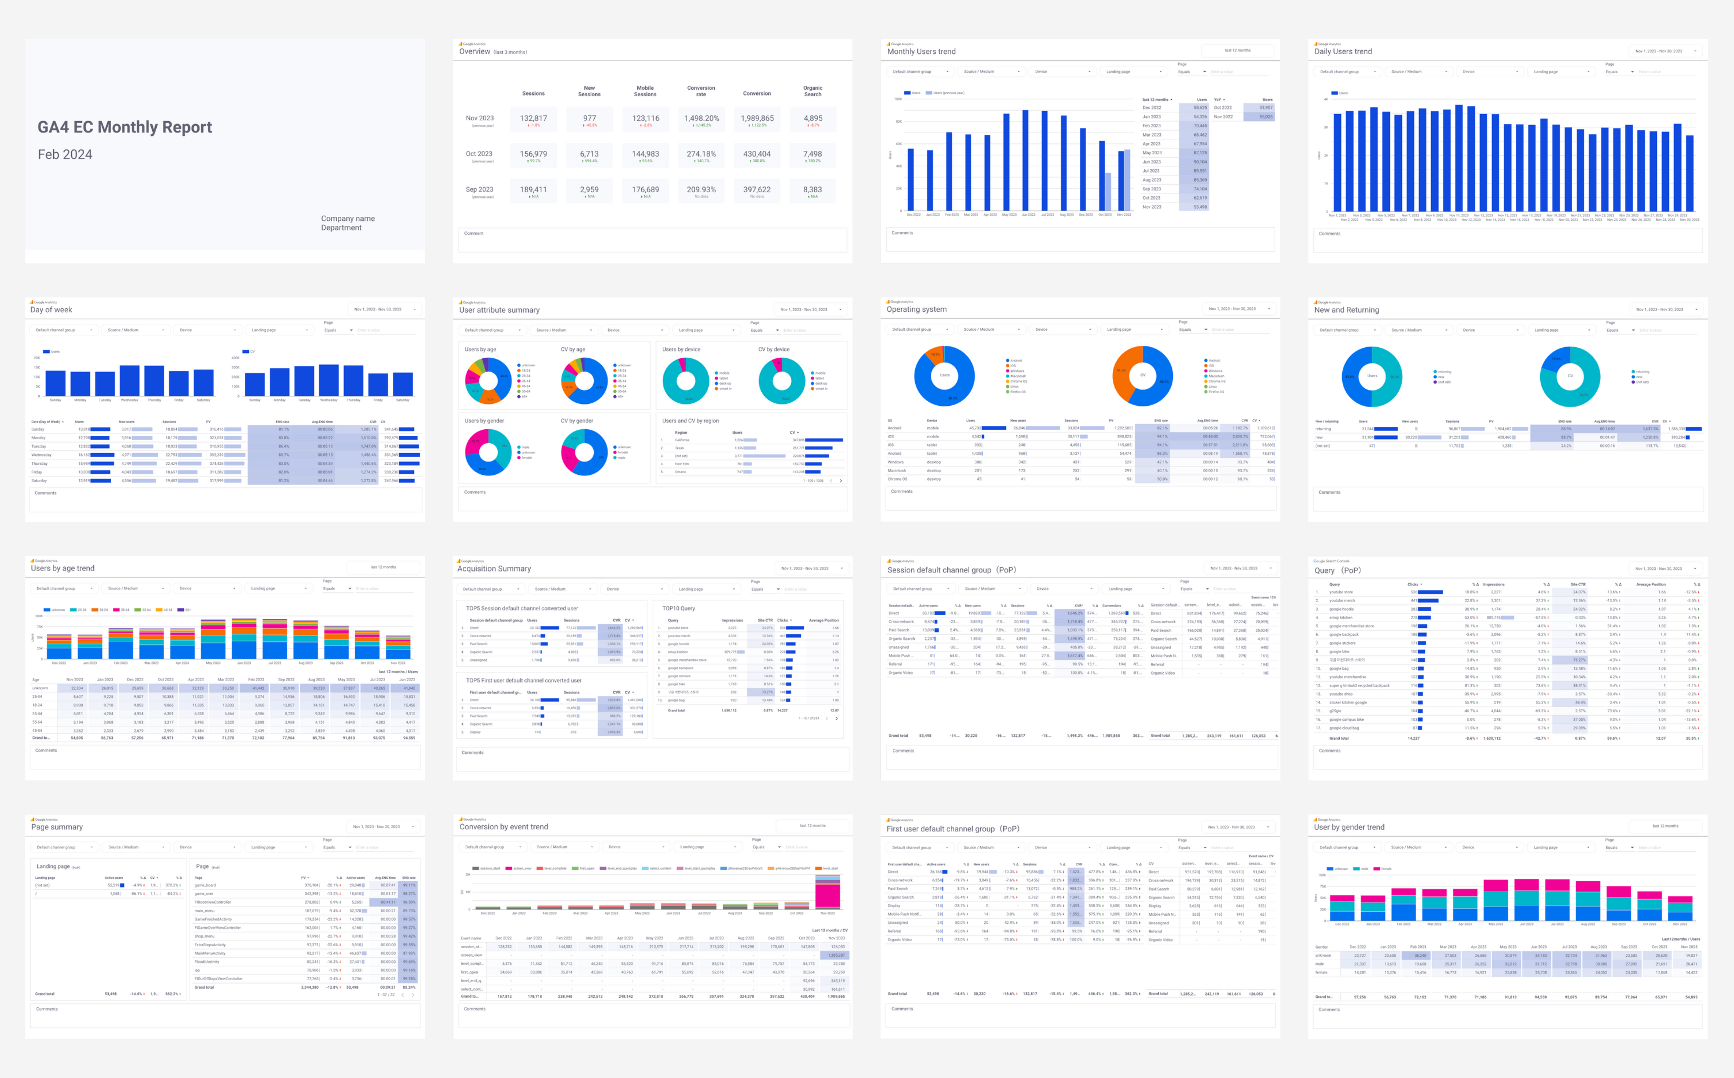
This all-in-one GA4 report template for eCommerce sites makes it easy for anyone to automate GA4 reporting and daily monitoring. With an impressive 99 pages, it covers a wide range of reporting needs (unneeded pages can be hidden). One-time purchase allows unlimited use across multiple sites. Simply copy the report to create it in just a few minutes. Freely customize the date range and layout to suit your needs.
Data Sources
- Google Analytics
Key Features
- One-Time Purchase, Lifetime Use: Pay once and get ongoing access without recurring costs.
- Unlimited Sites & Accounts: Report across unlimited sites, even those connected to different Google accounts.
- Commercial Use Approved: Charge clients for reports built with this template.
- Fully Customizable: Tailor every element to meet unique reporting needs.
- Always Updated: Our team continuously updates the template to align with GA4's latest specifications.
- GA Experts on Board: Expert advisors oversee template accuracy and functionality.
- Instant Report Generation: Copy, paste, and generate professional reports in just minutes.
Product Details
- Output: Looker Studio
- Historical Data: Unlimited
Usage
Access the template and follow the included quick-start guide to get set up in under 3 minutes. Access the guide immediately after purchase or via email.
Report Contents
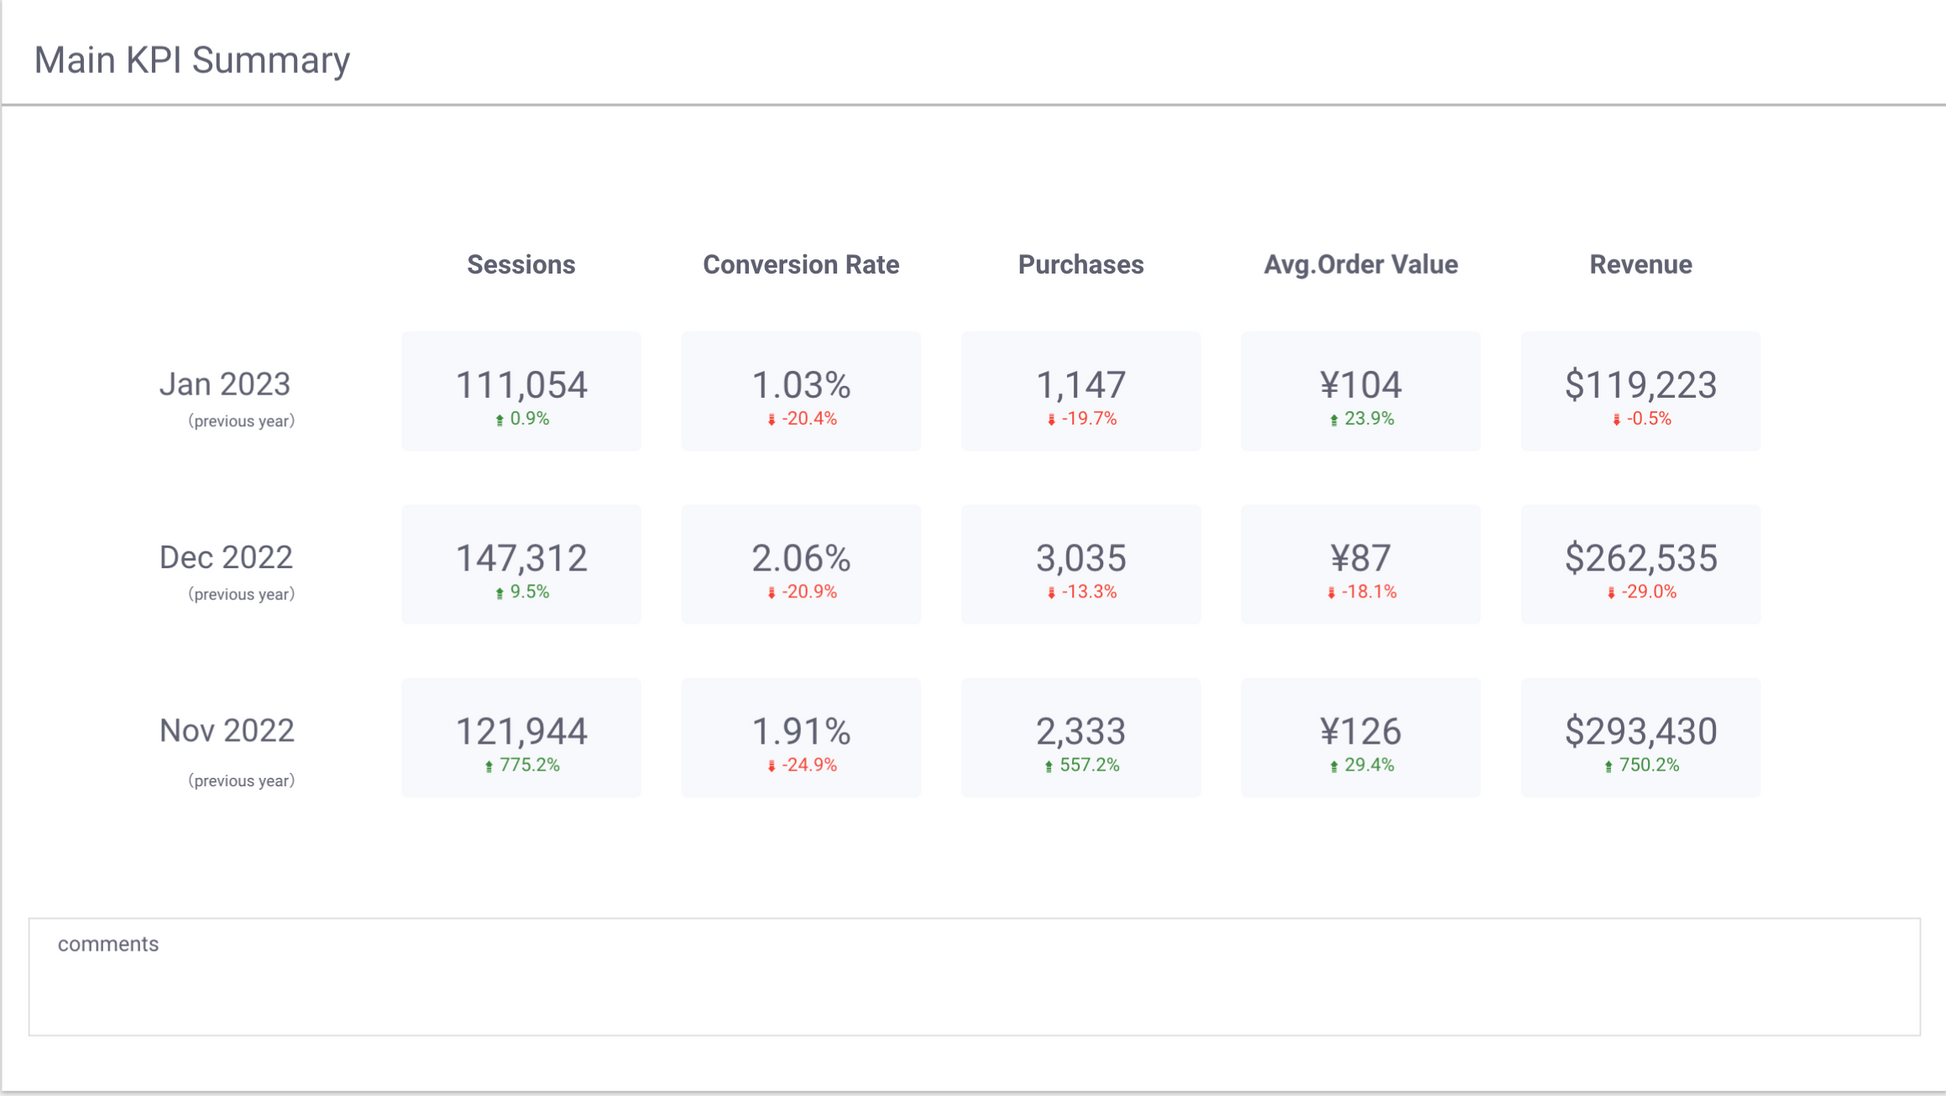
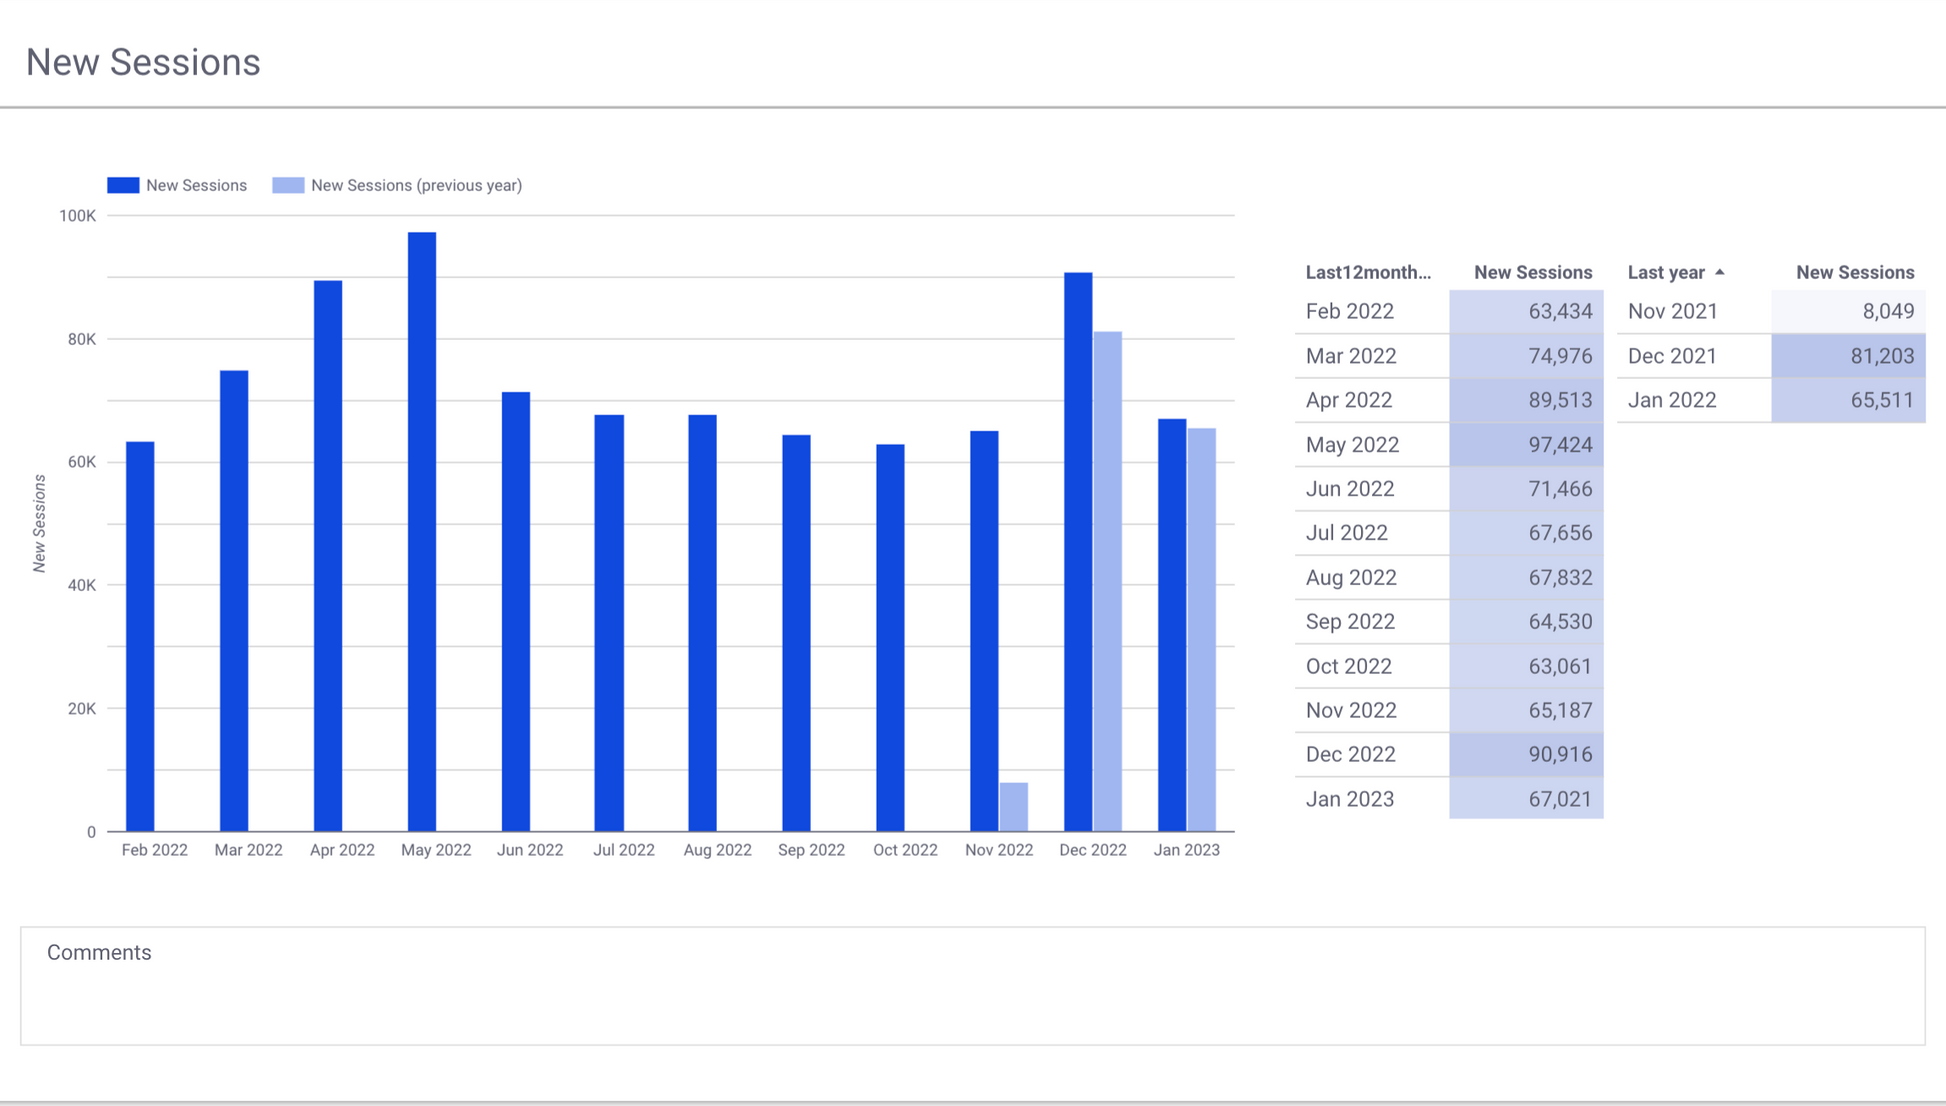
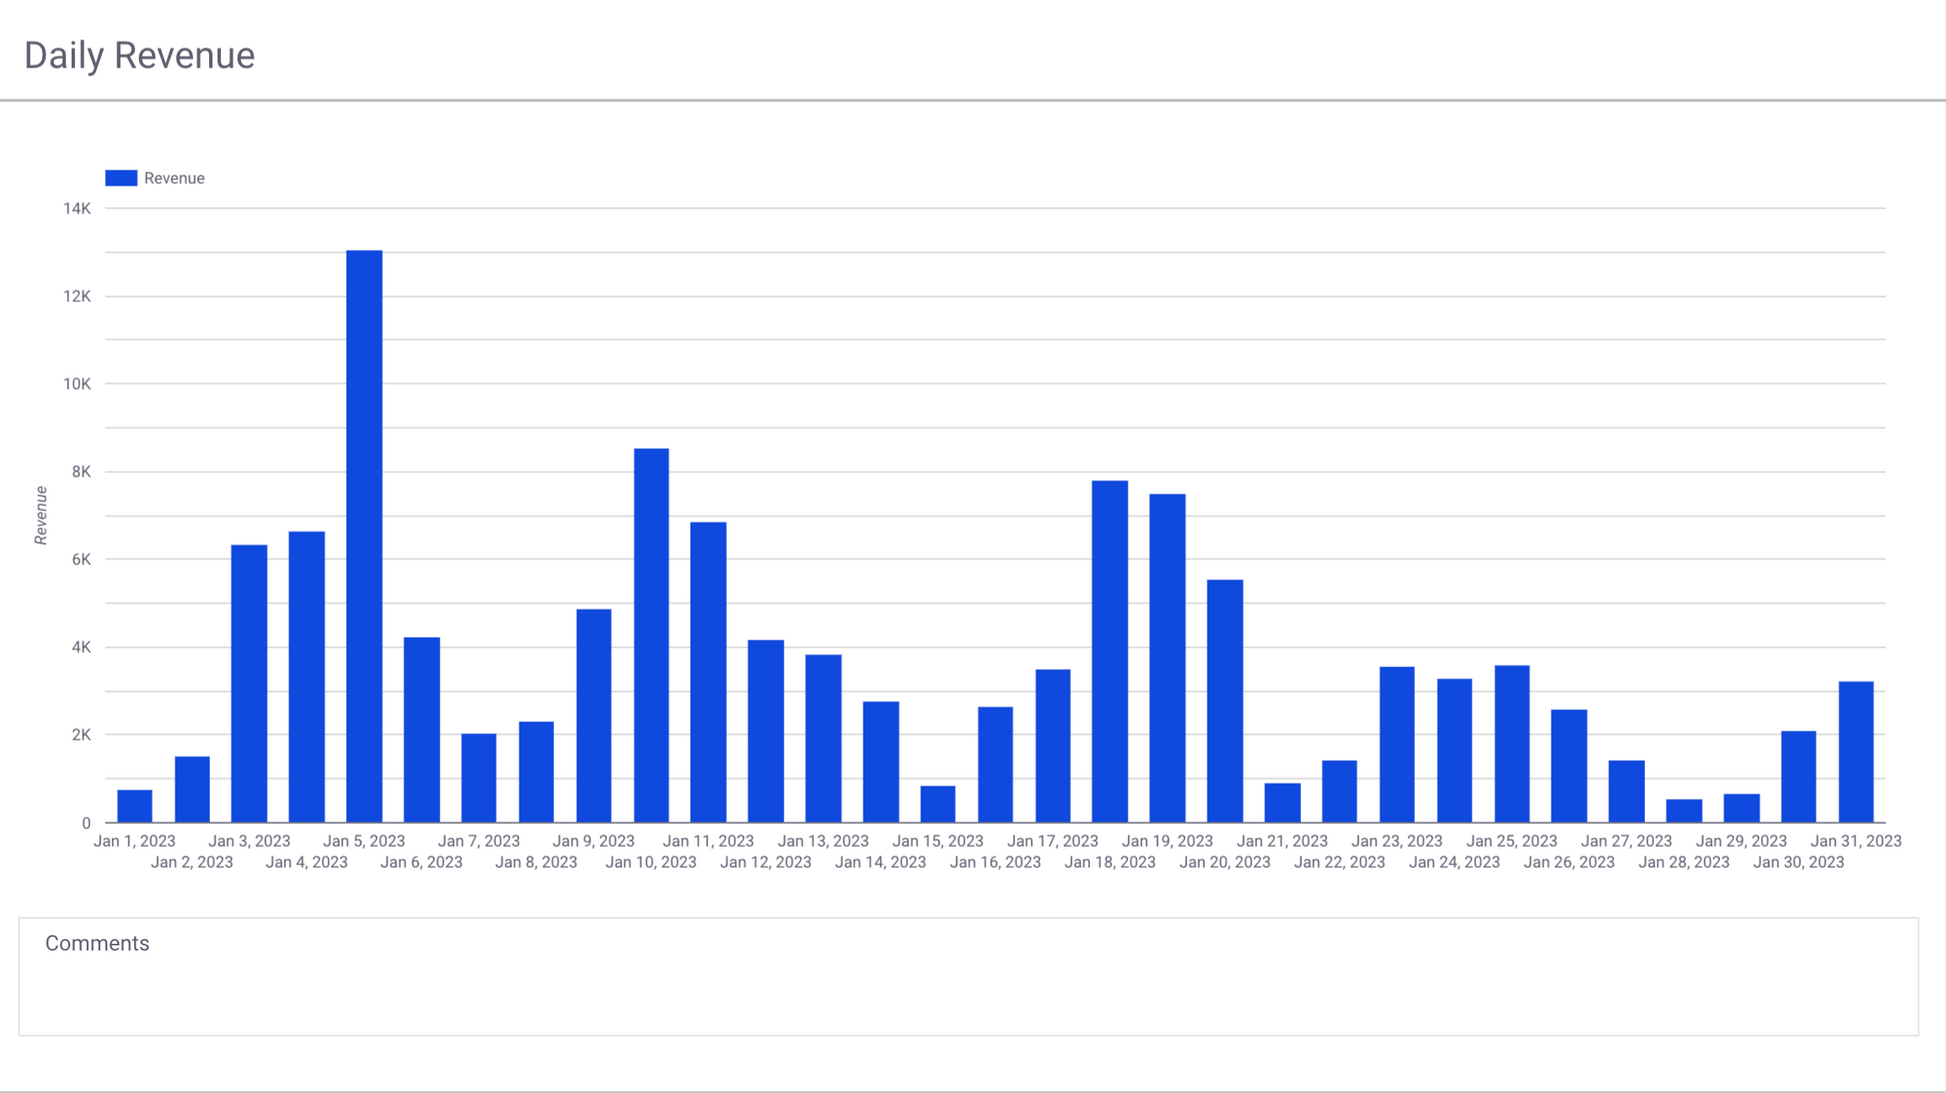
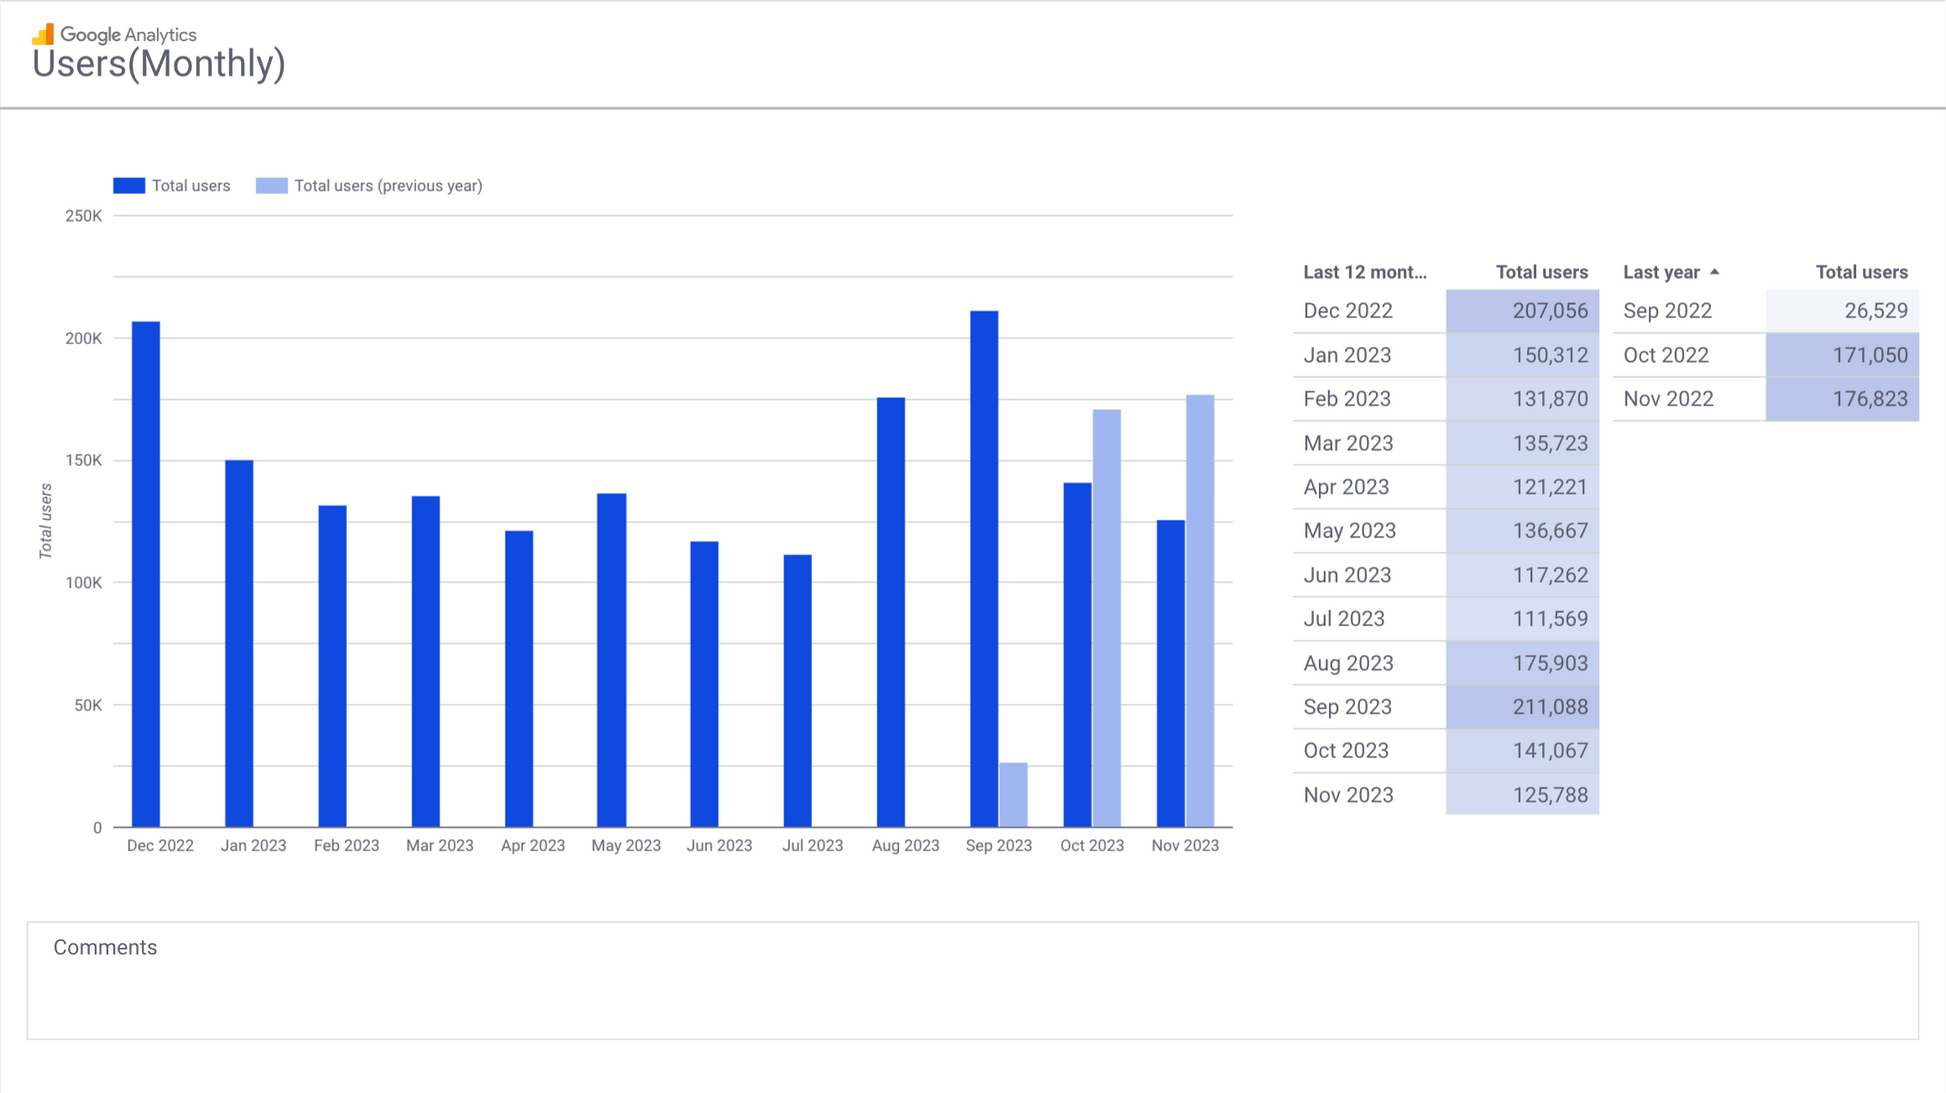
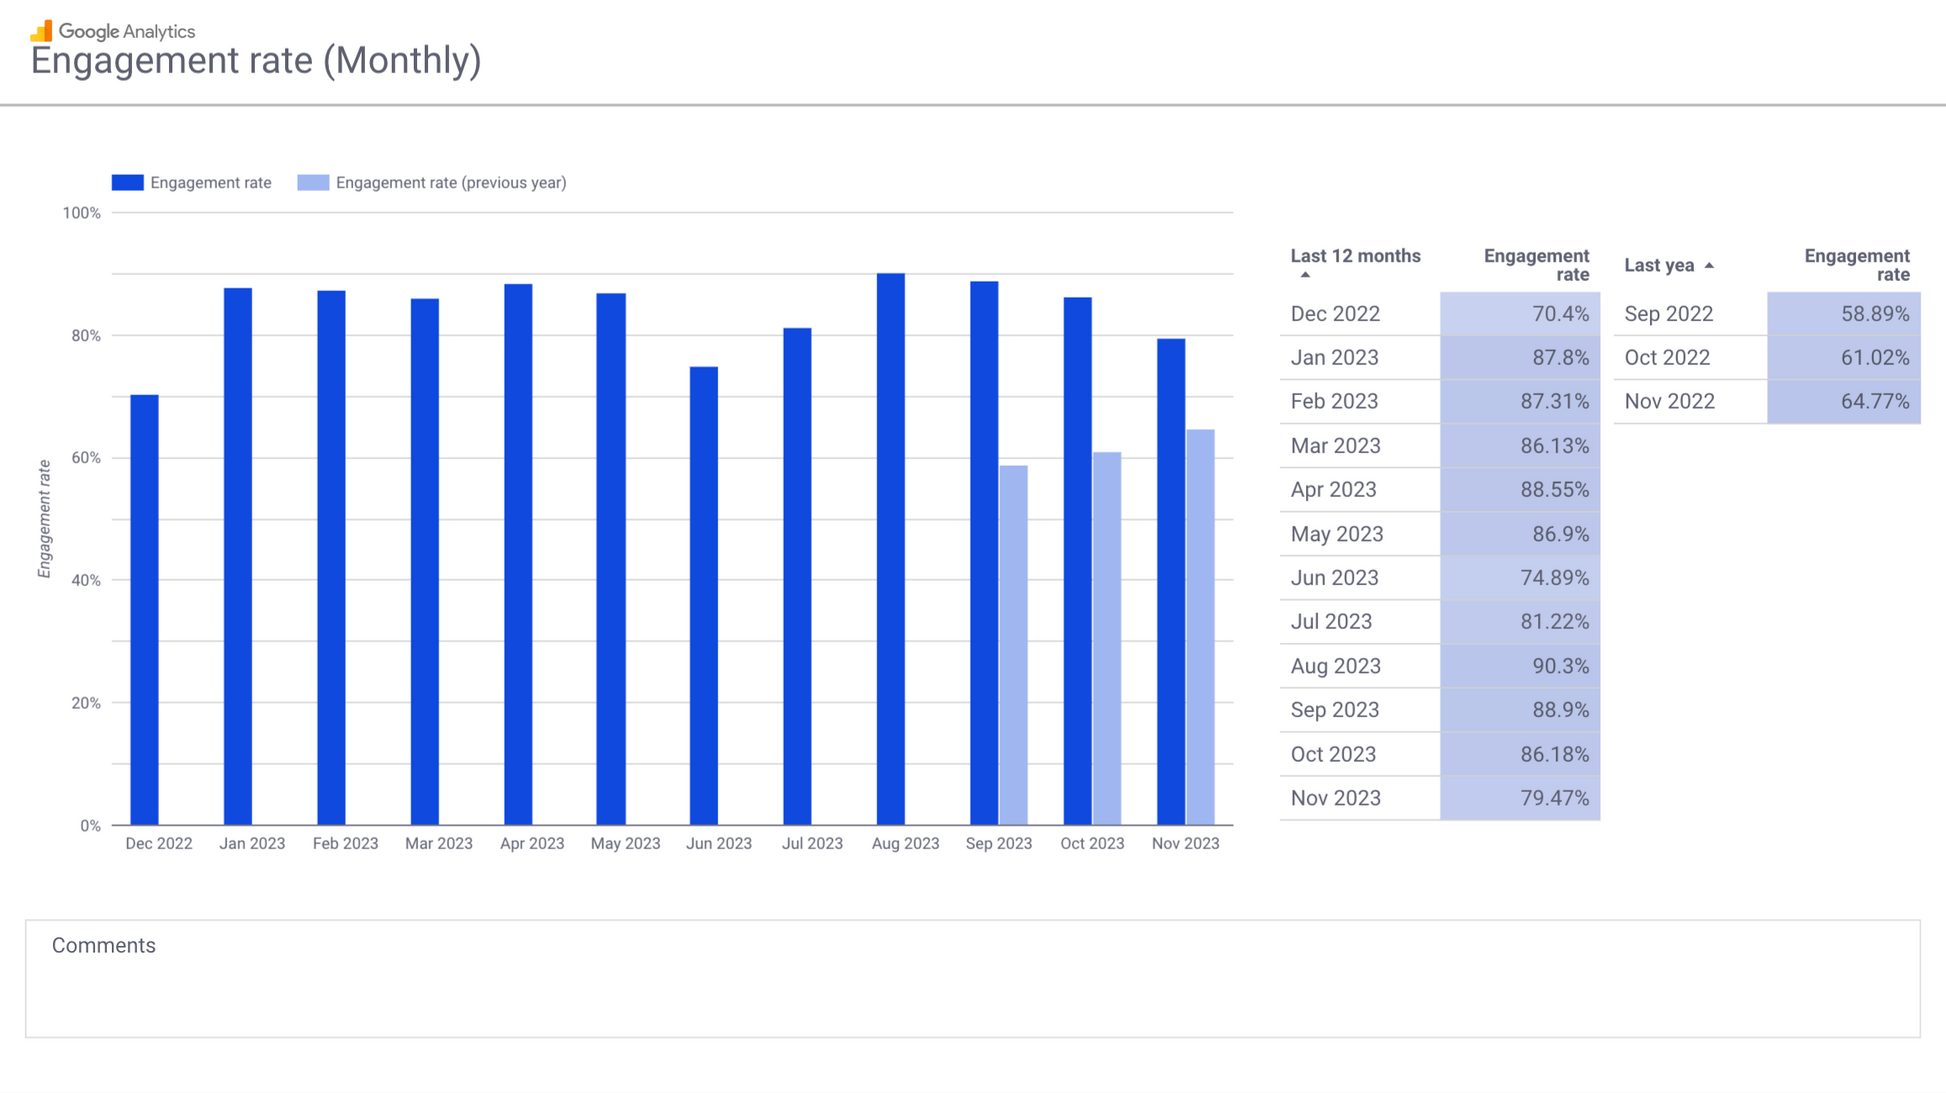
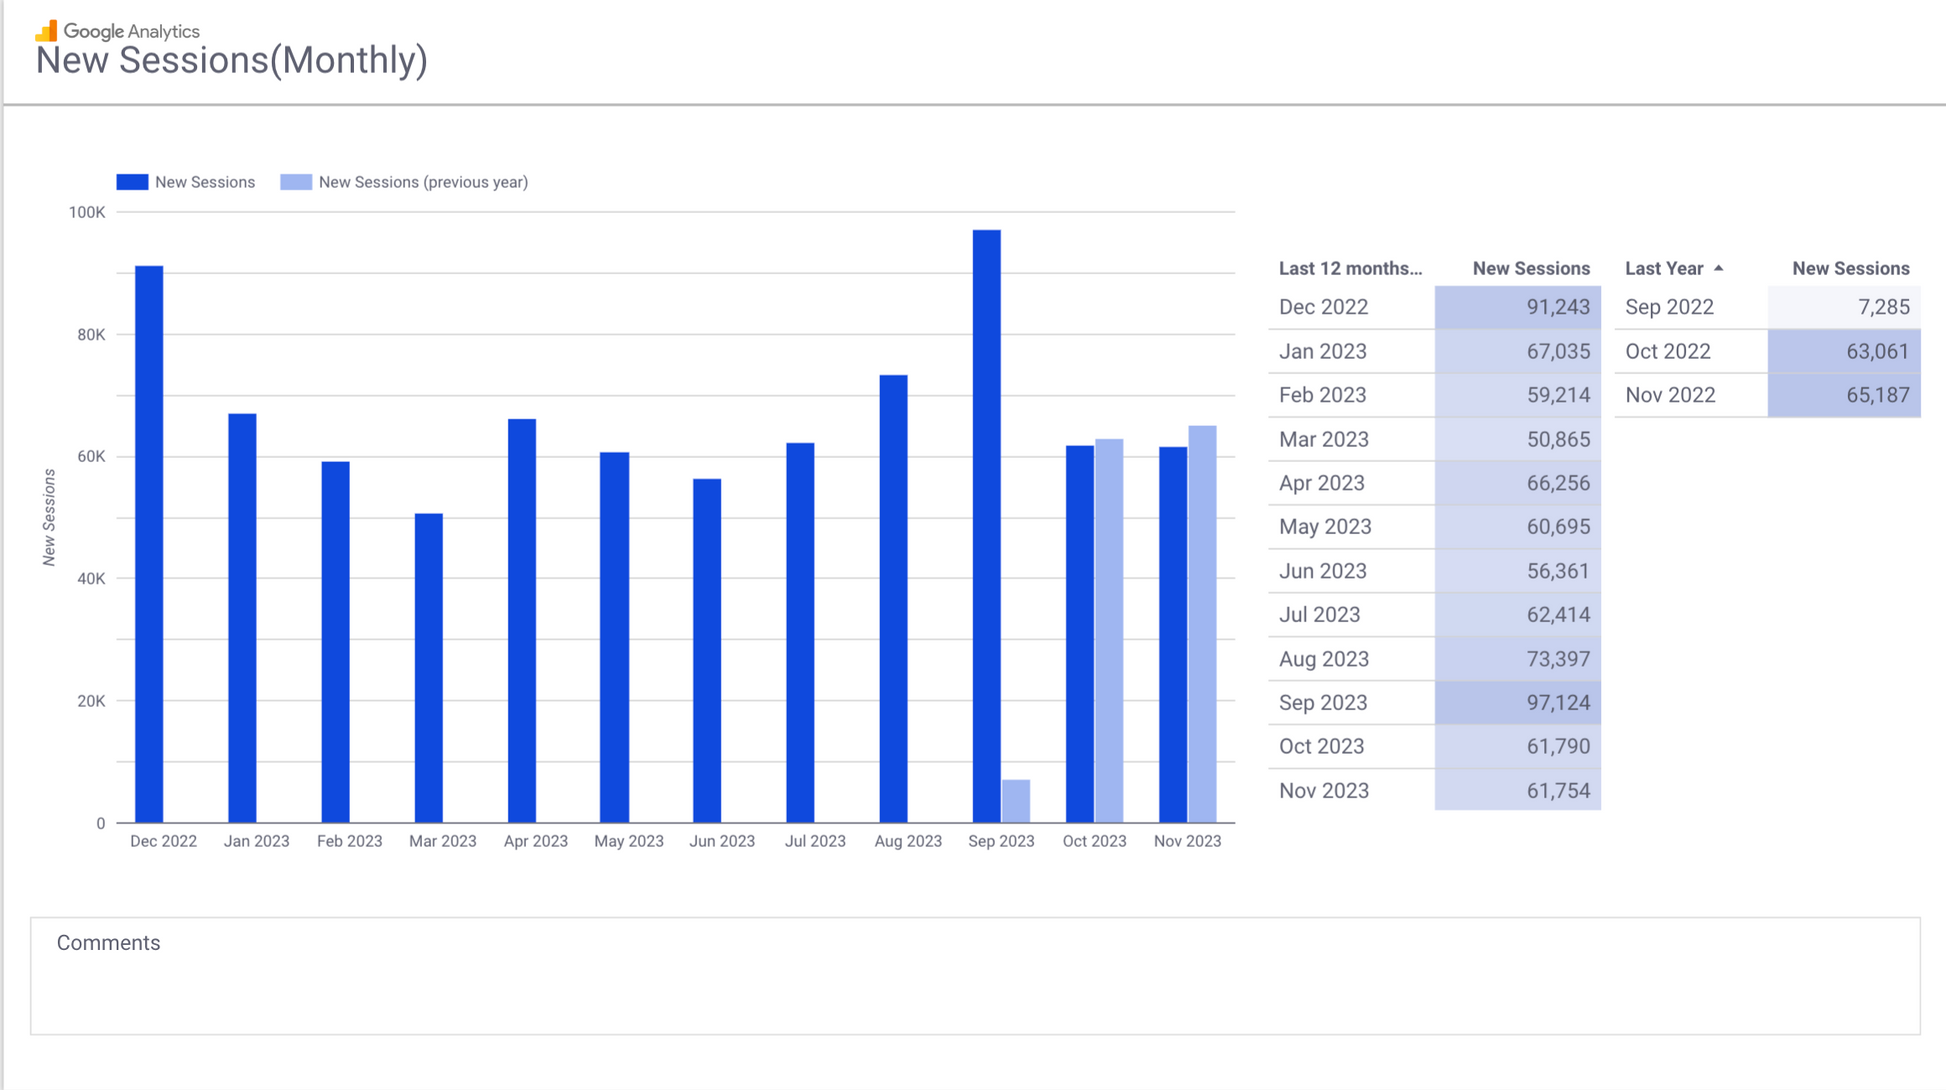
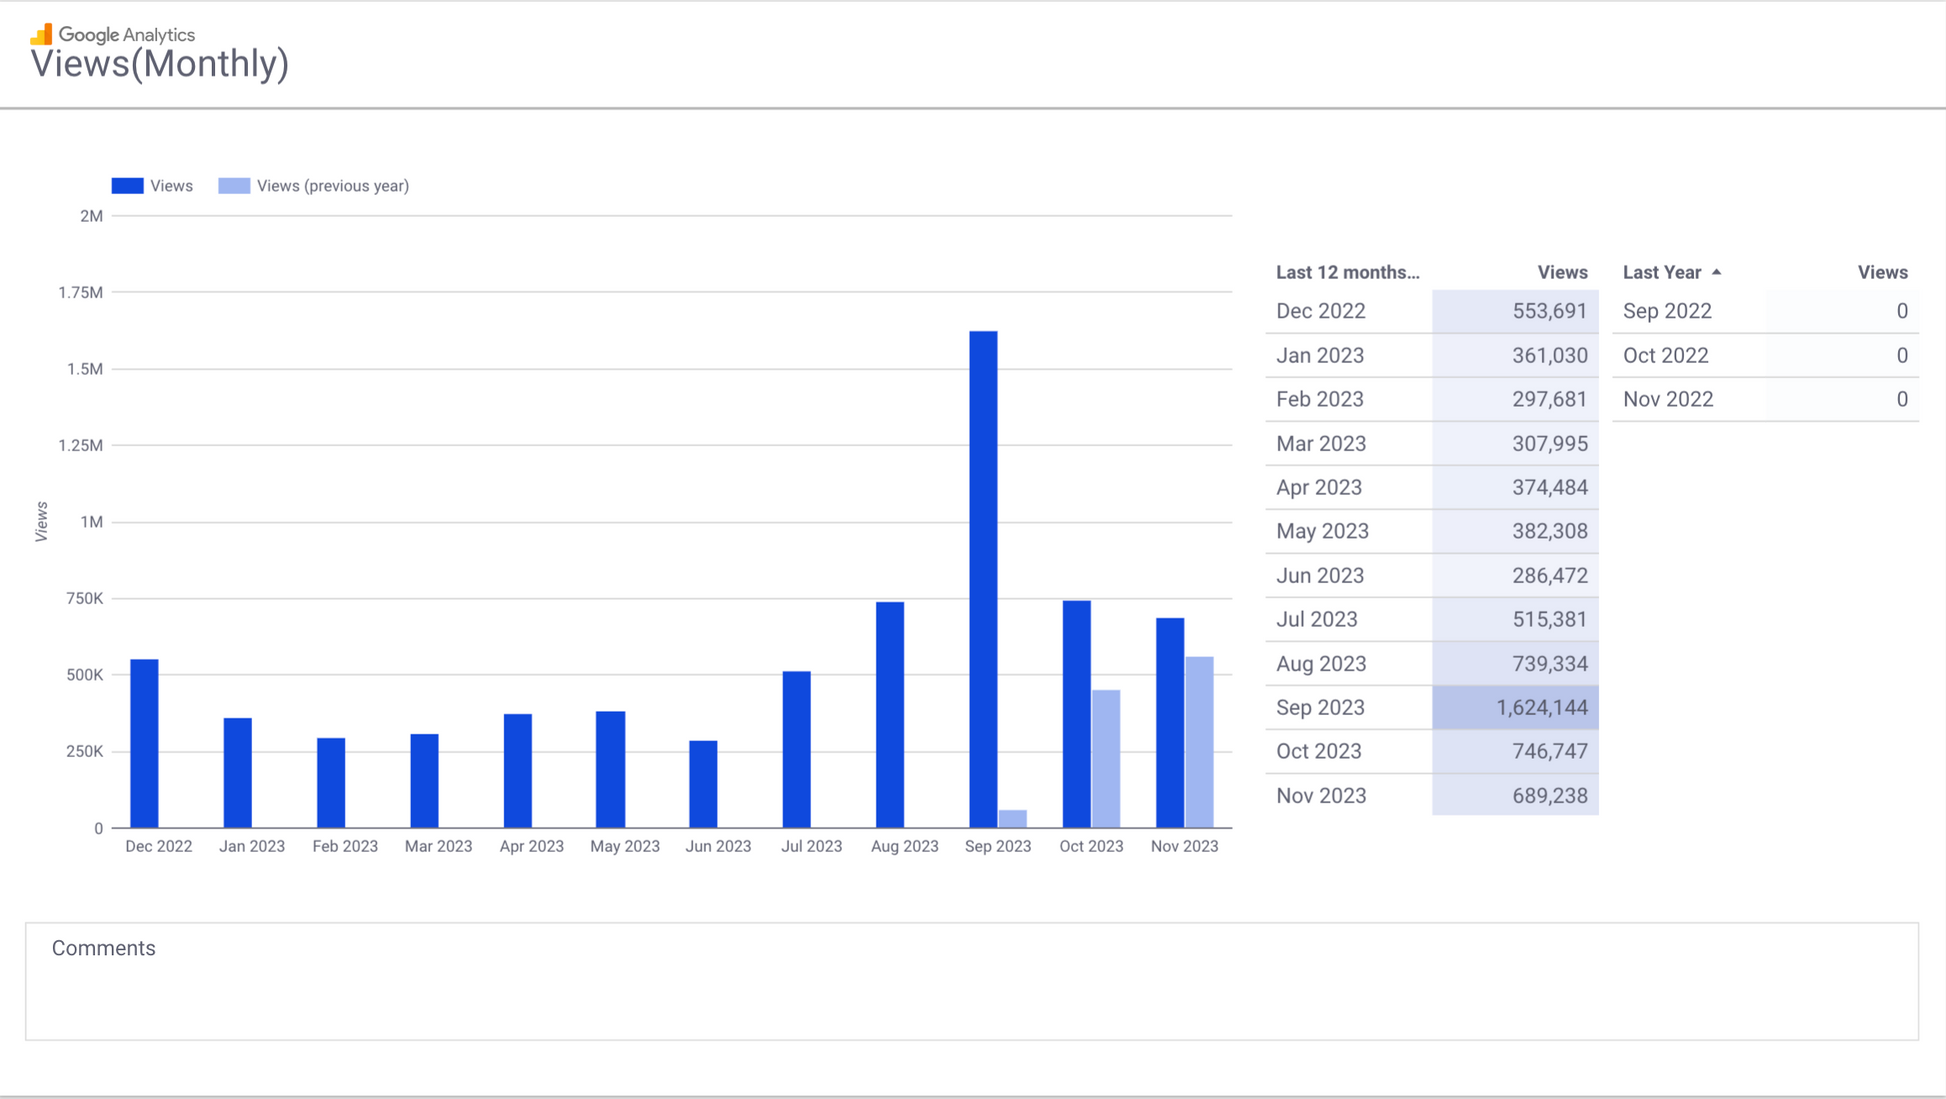
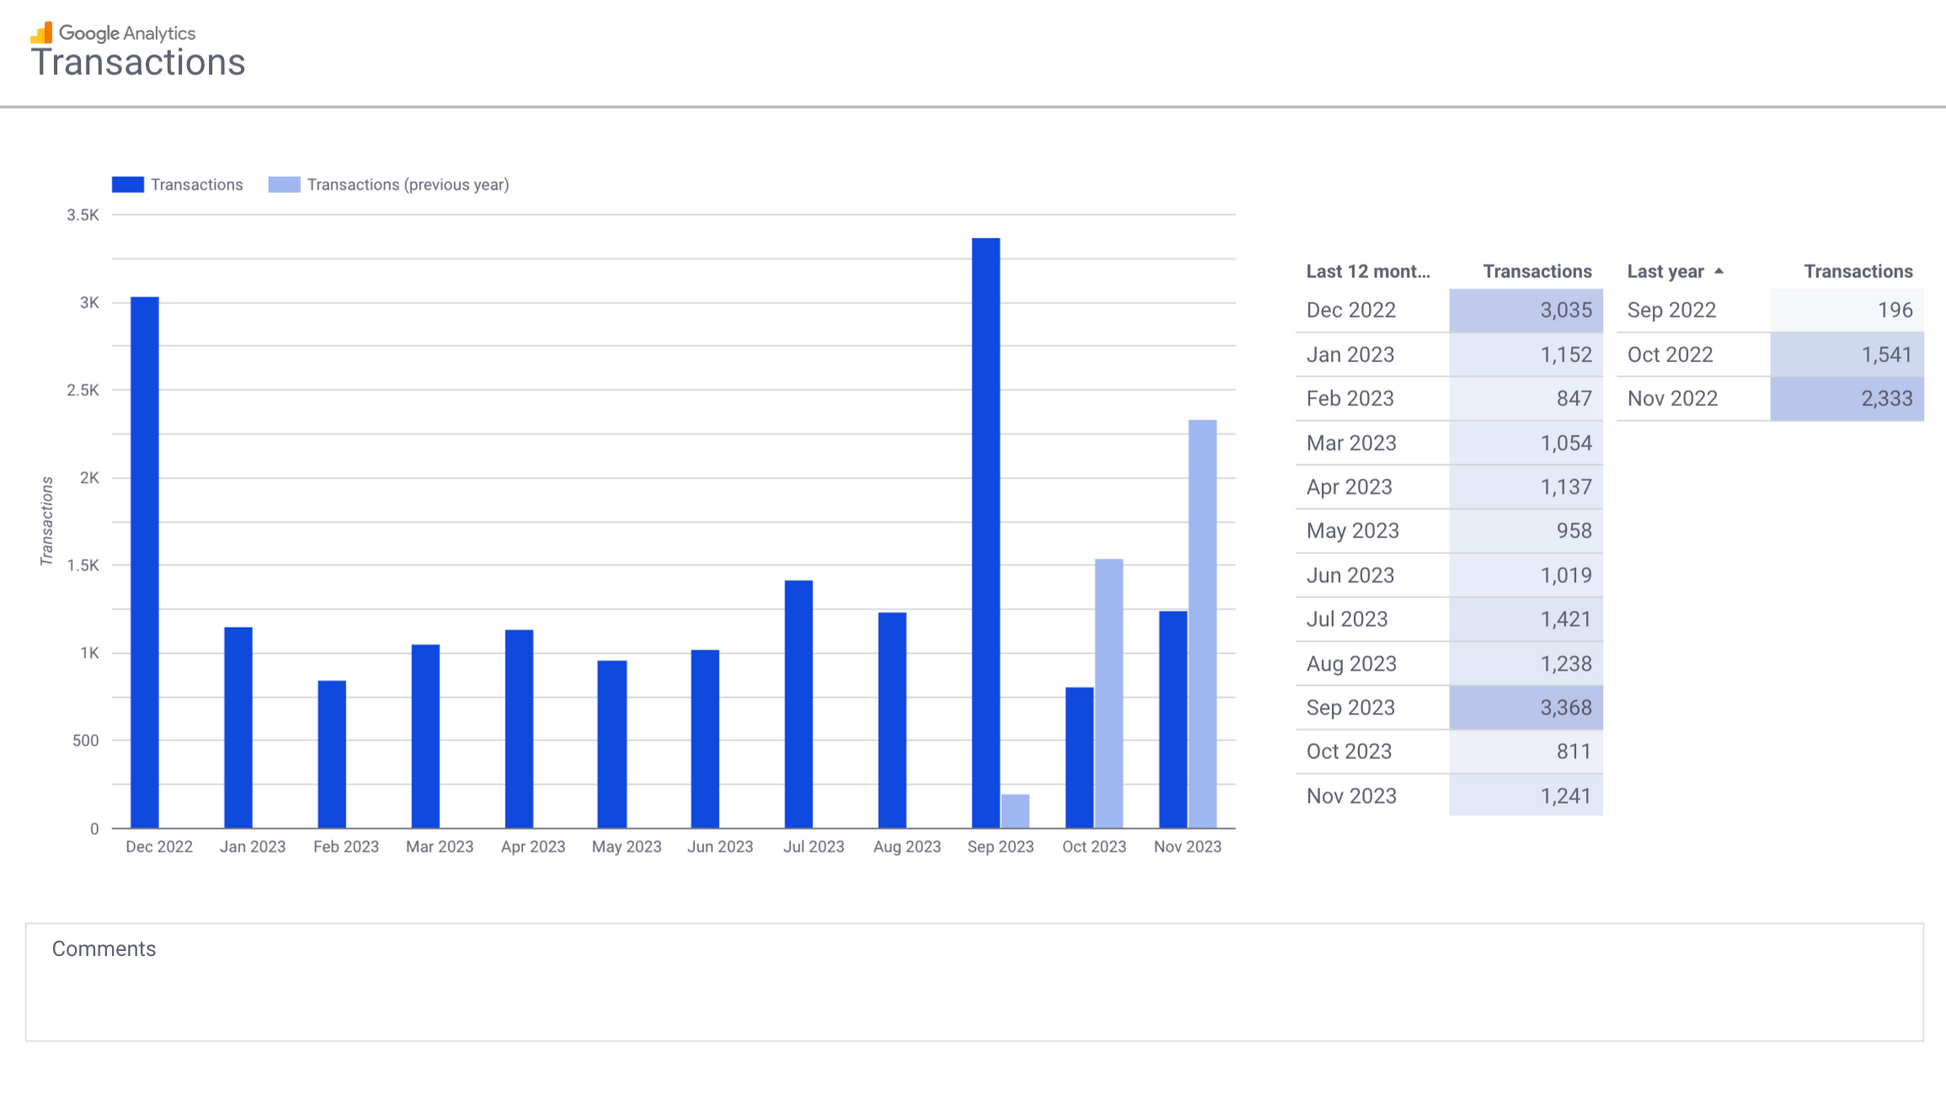
- Summary & Trends: Monthly, Daily, MoM/YoY, and last 3 months' overviews, user behaviors, engagement, and conversions.
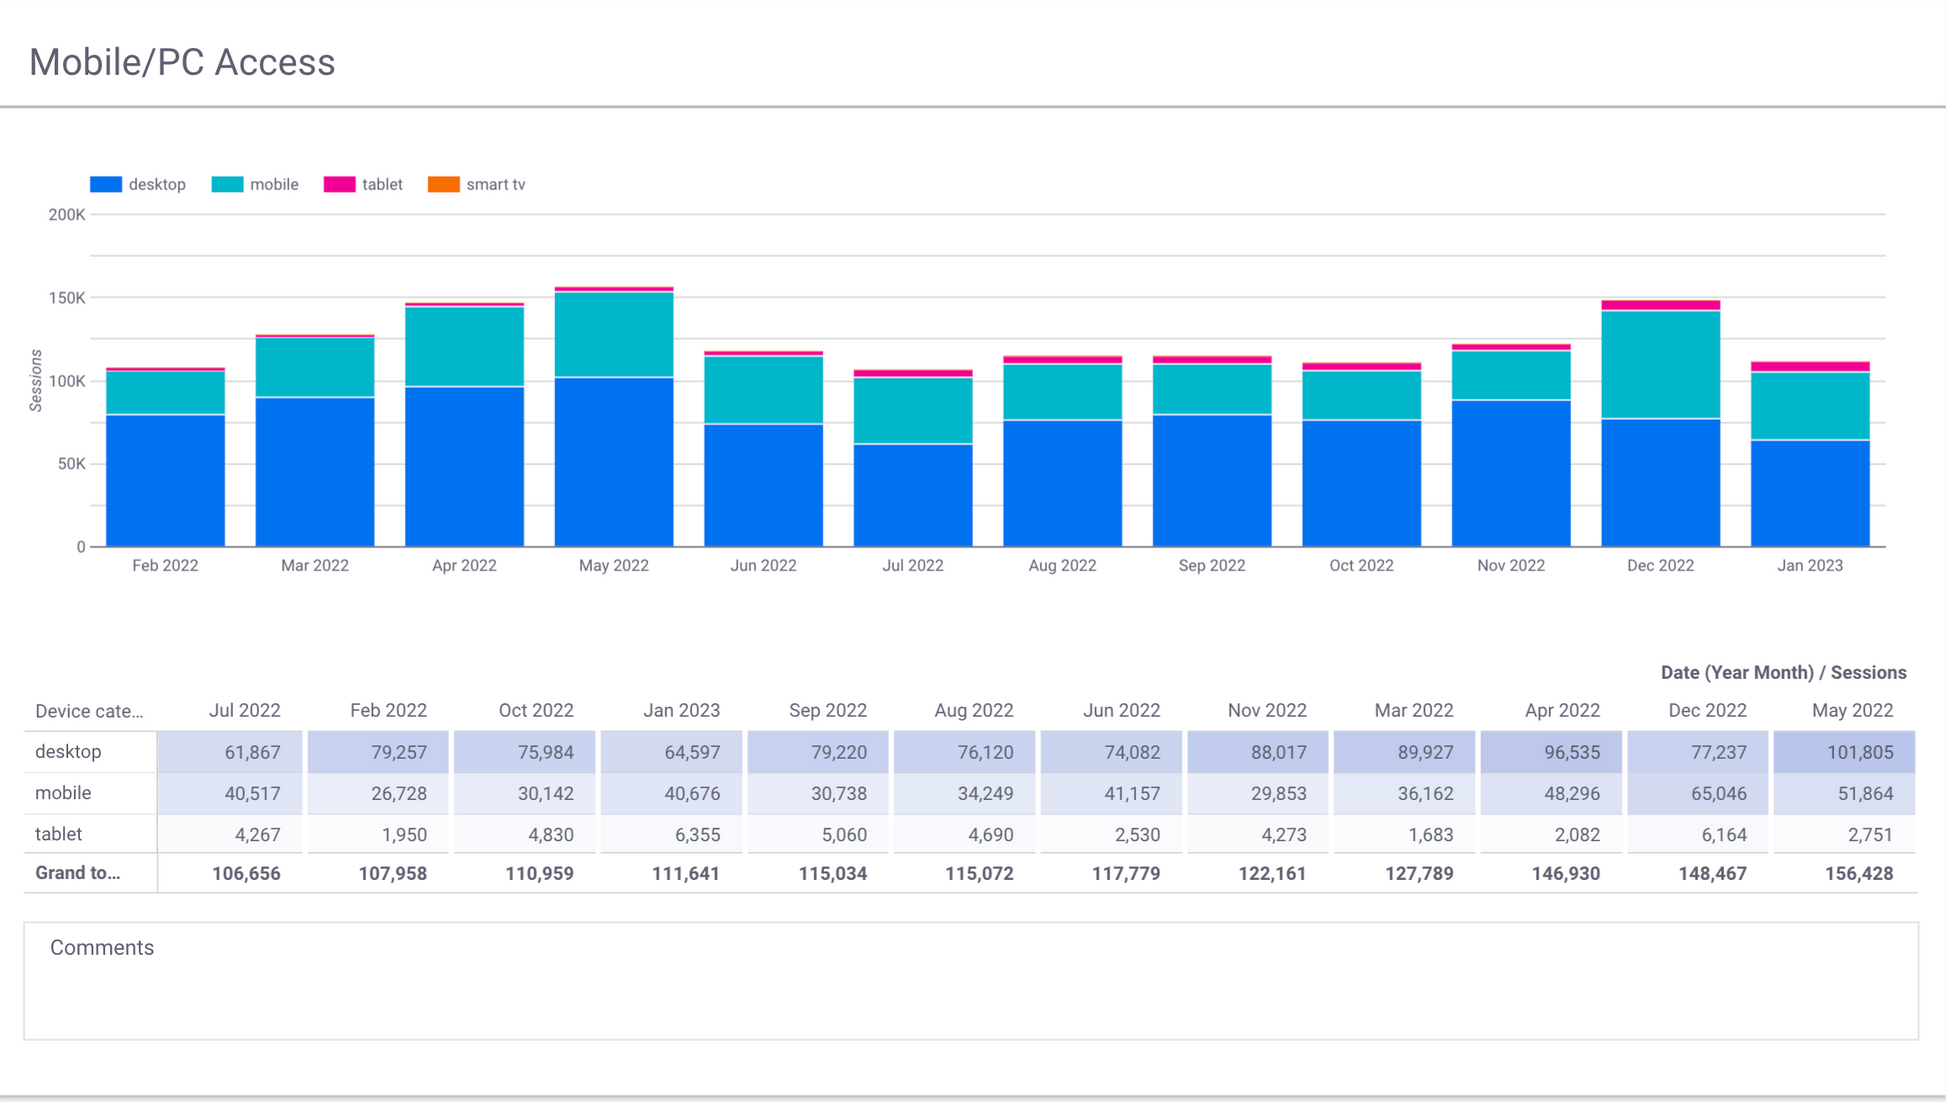
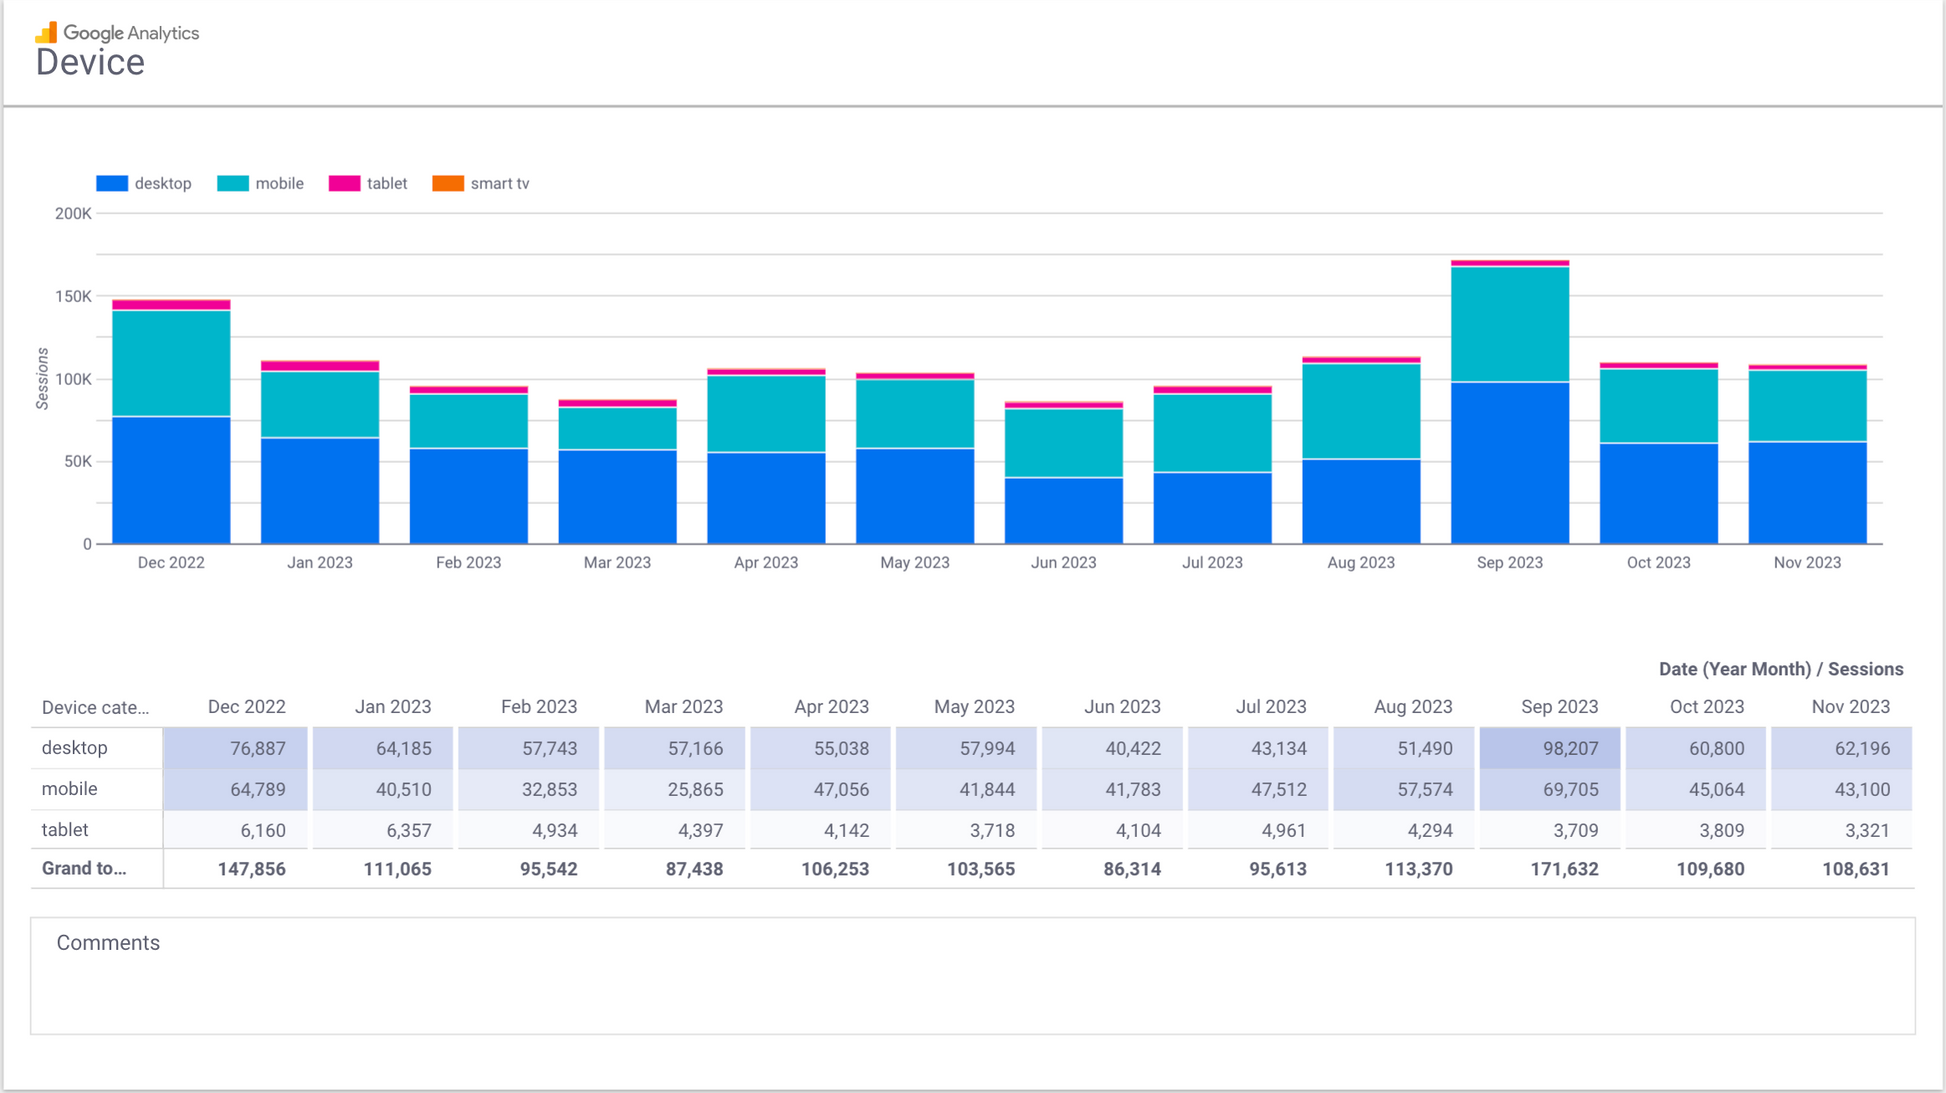
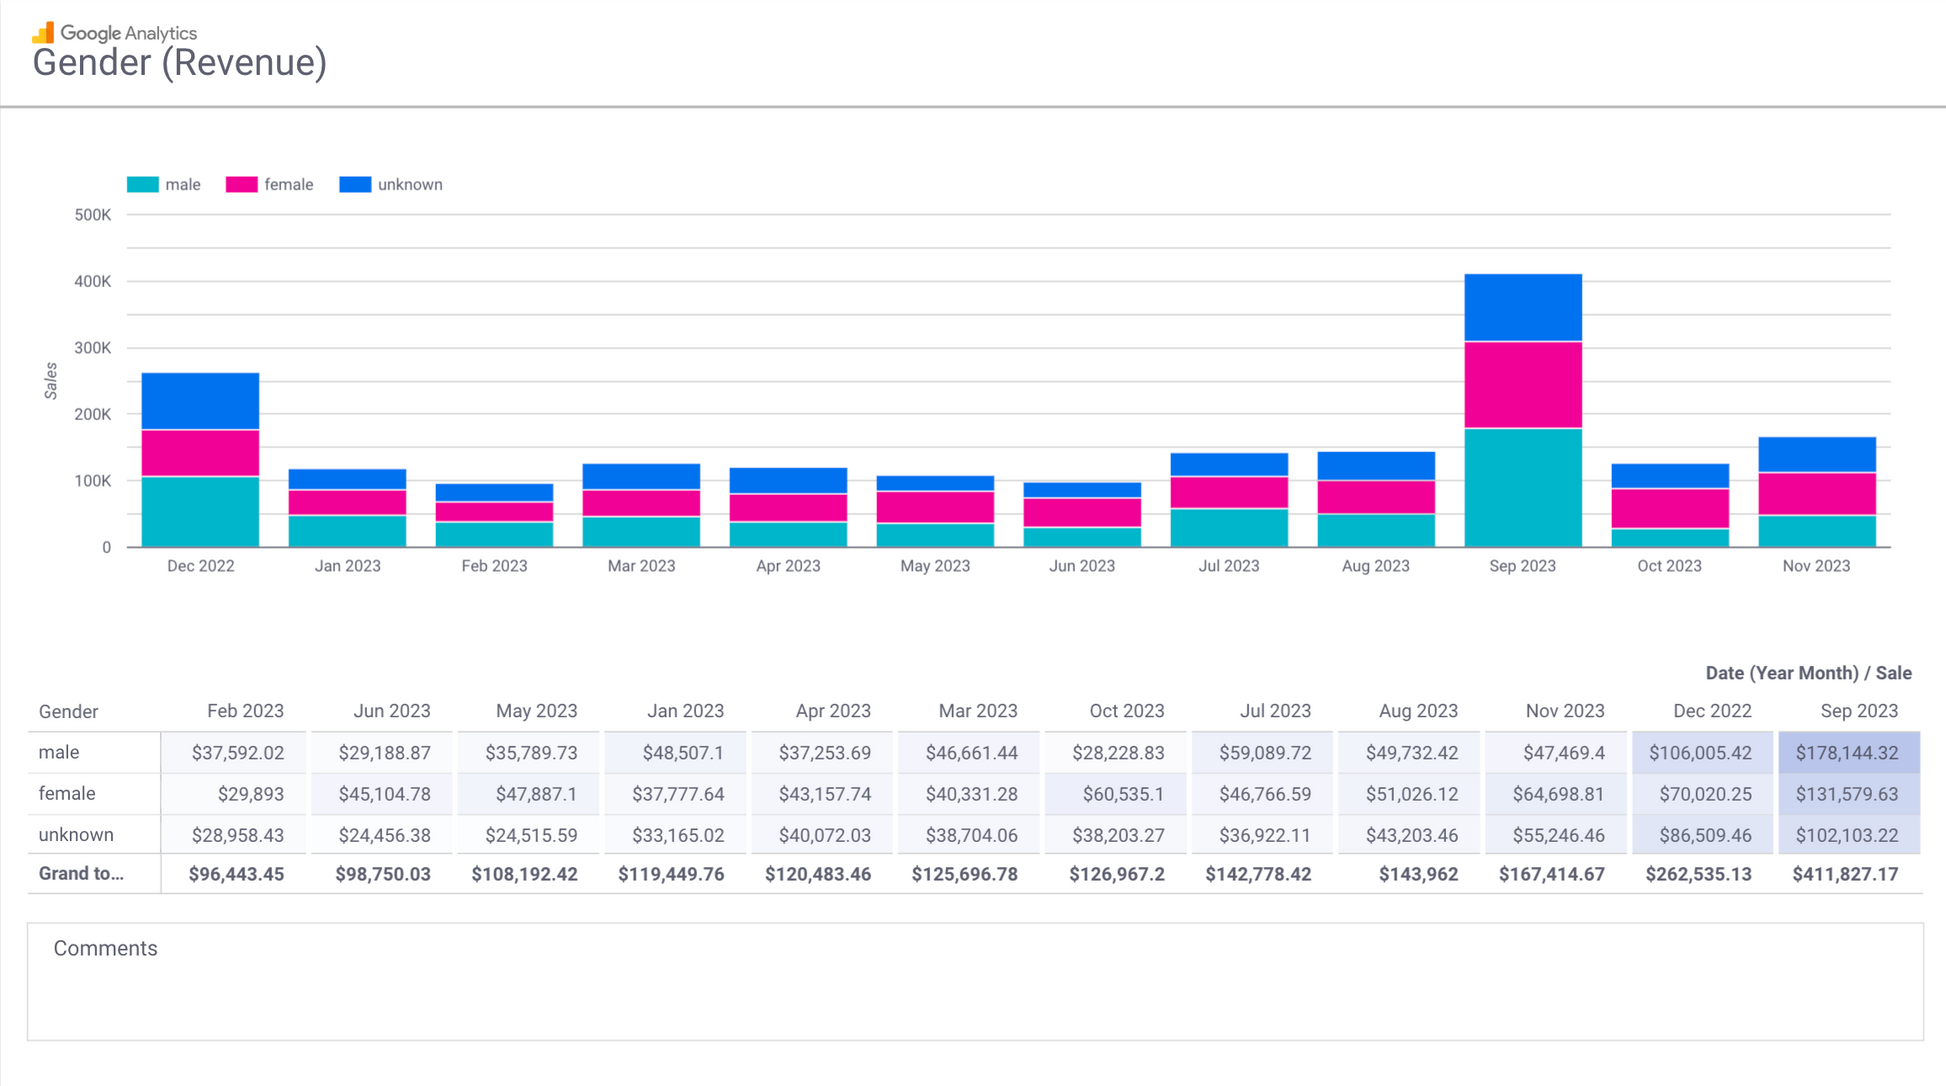
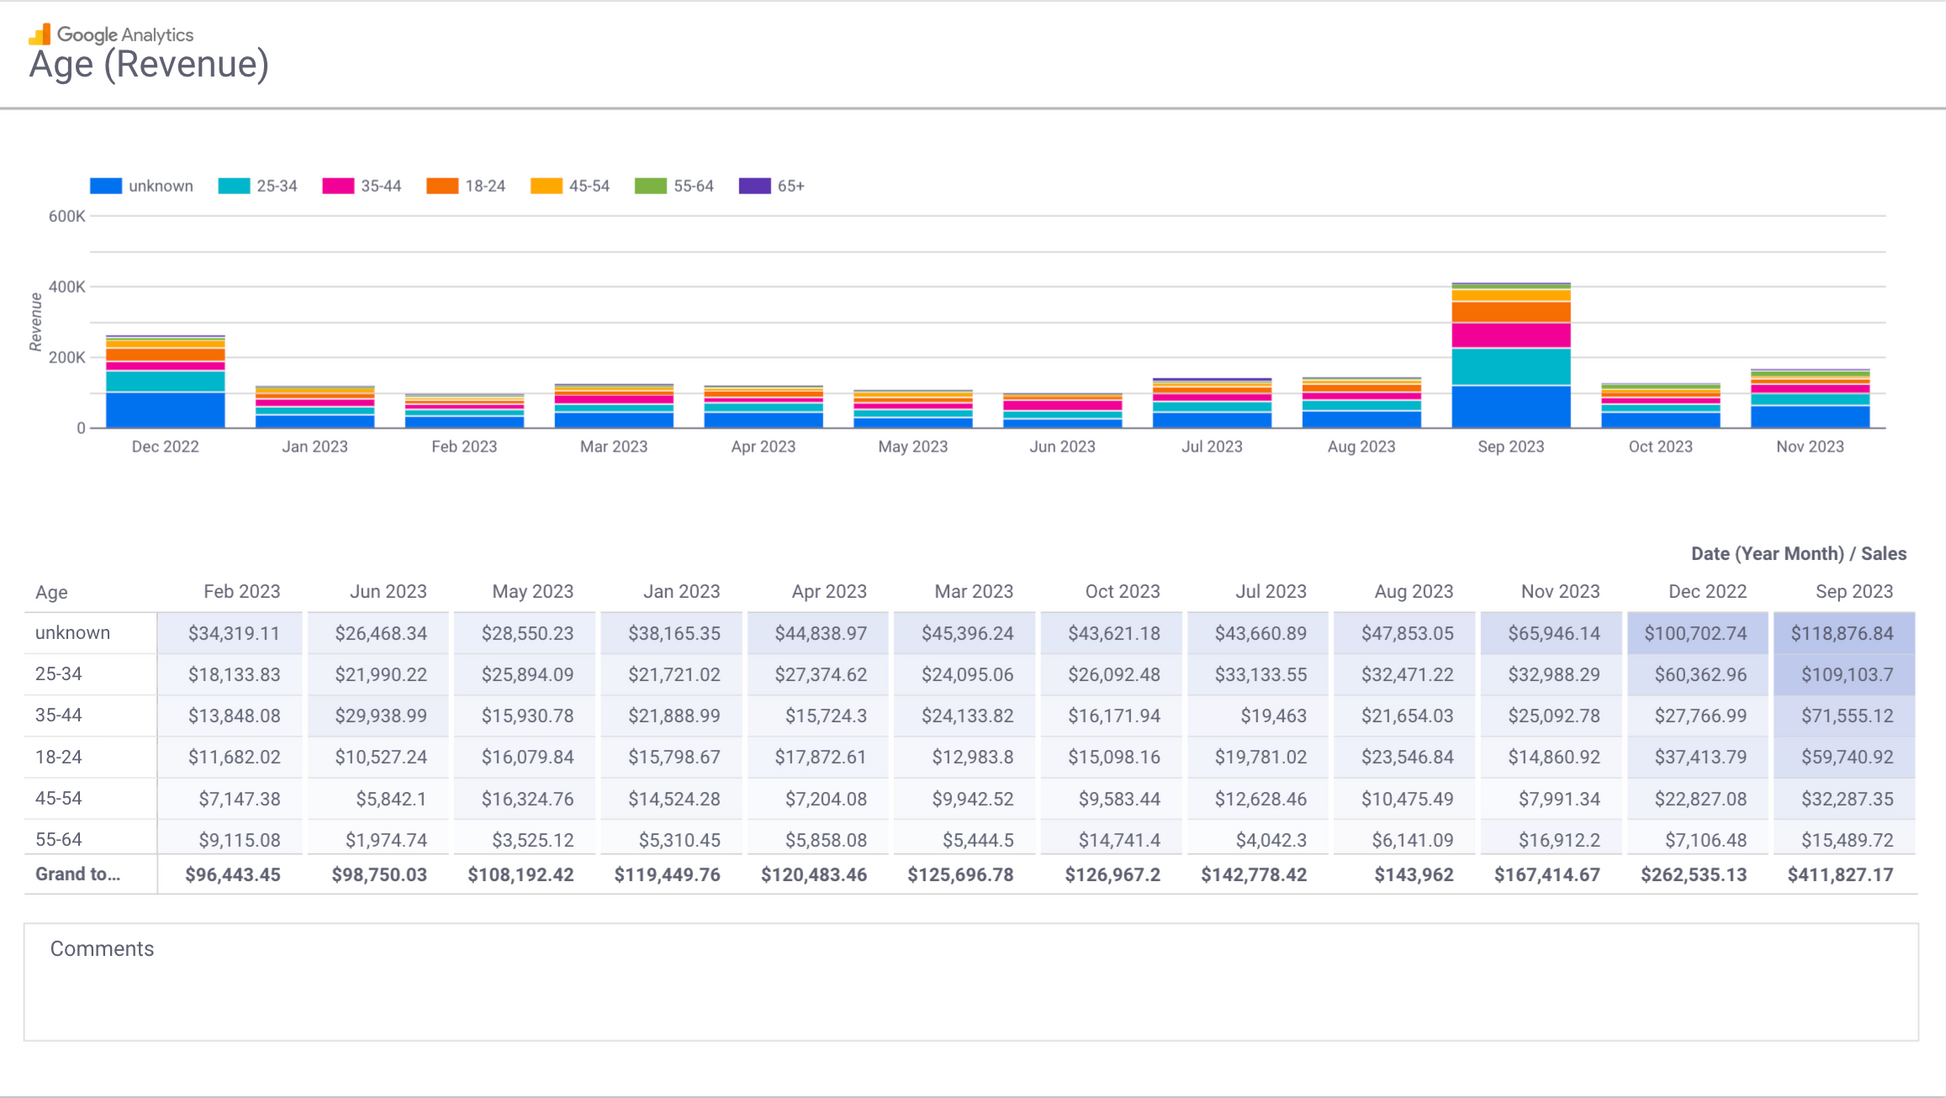
- User Analysis: Breakdowns by demographics, device, location, and more.
- Attraction & Acquisition: Detailed views of traffic sources, including organic and paid.
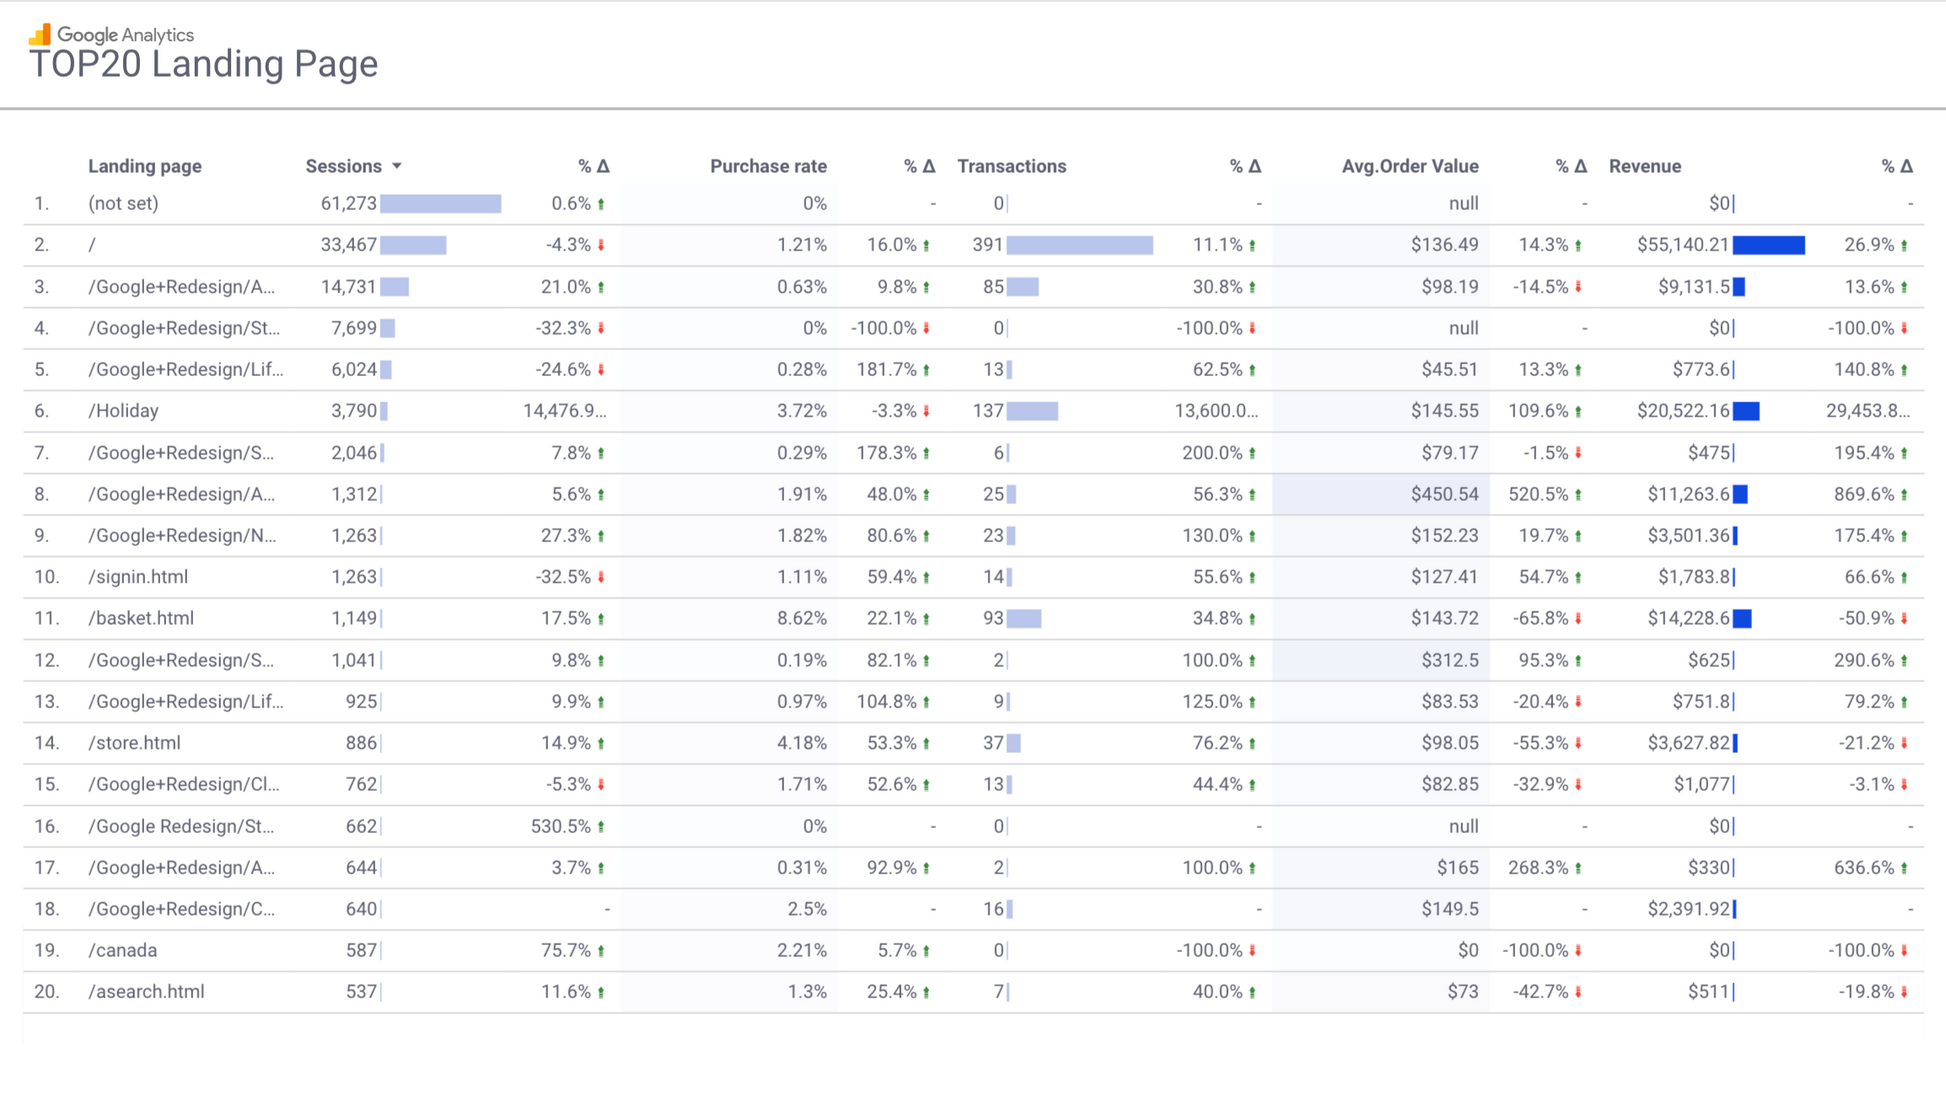
- SEO Metrics: Organic search data, query performance, and landing page insights.
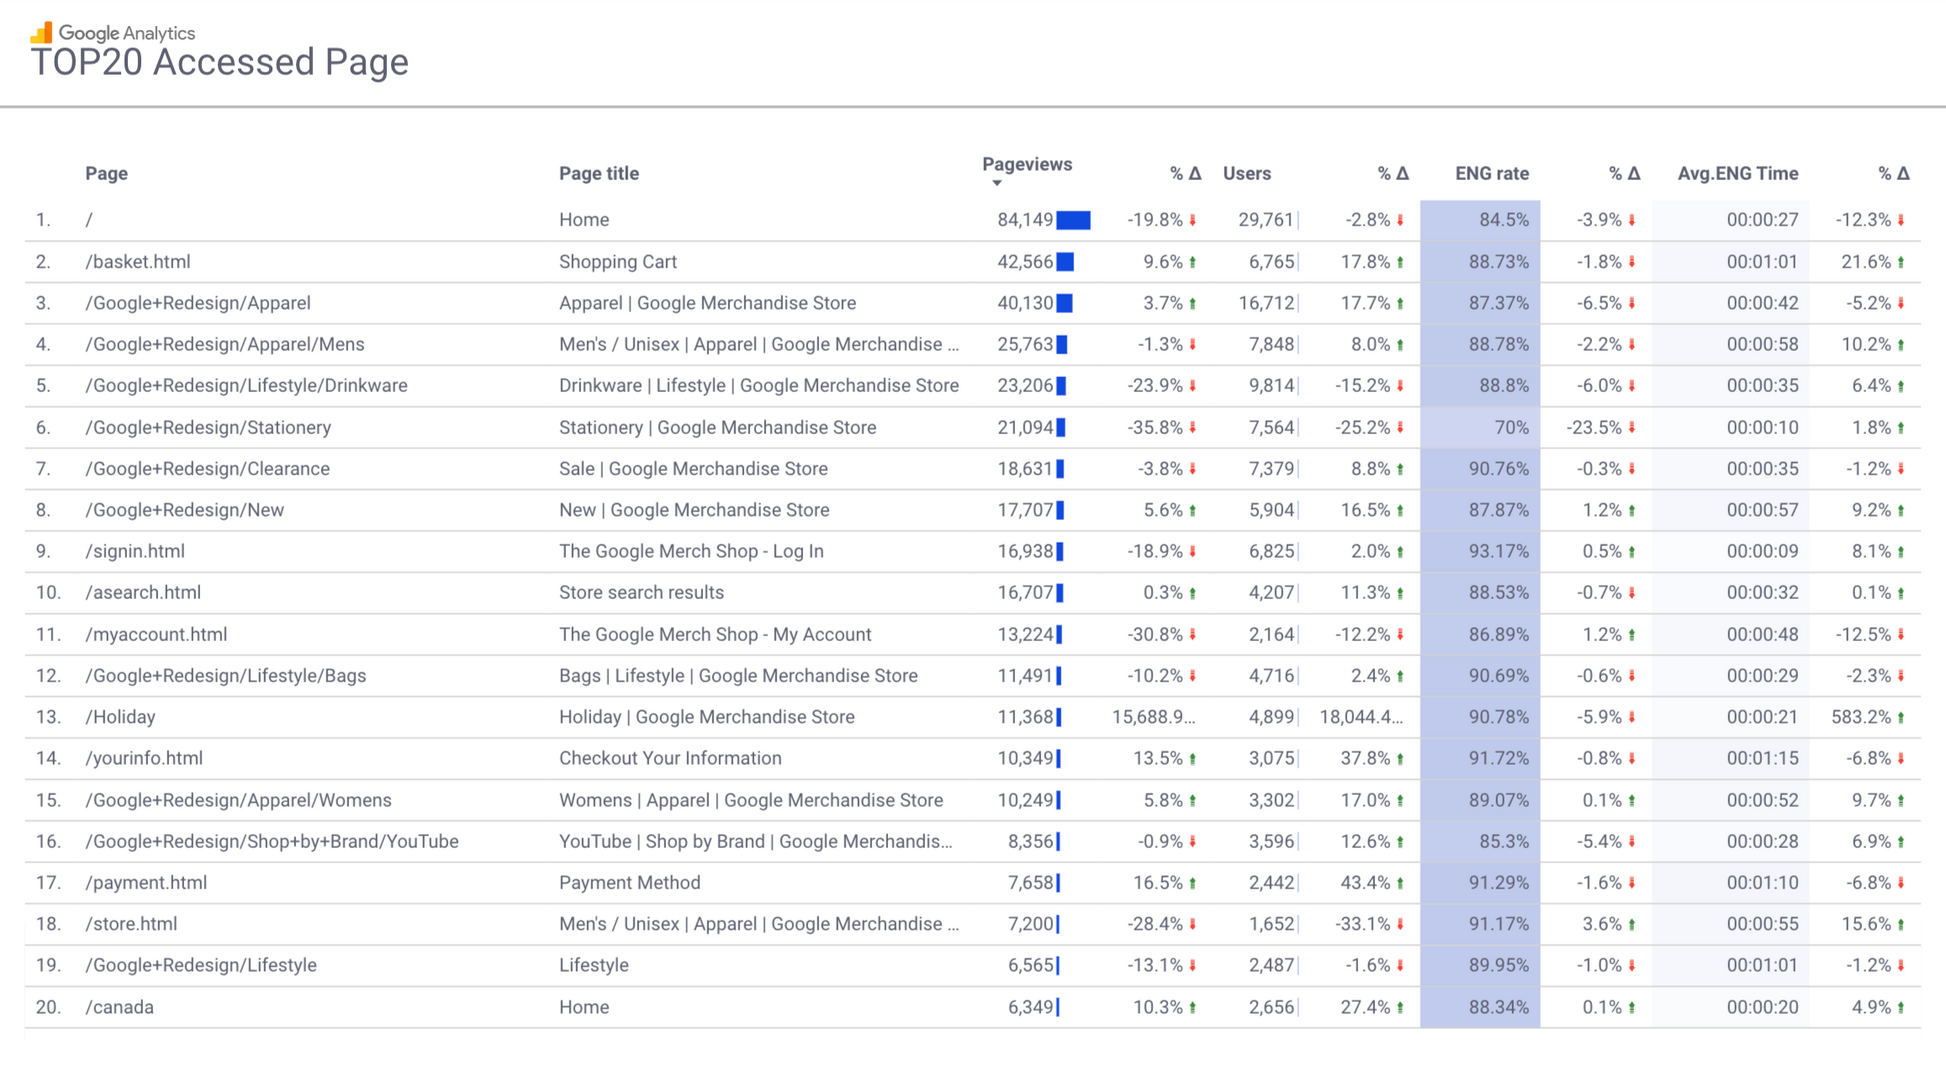
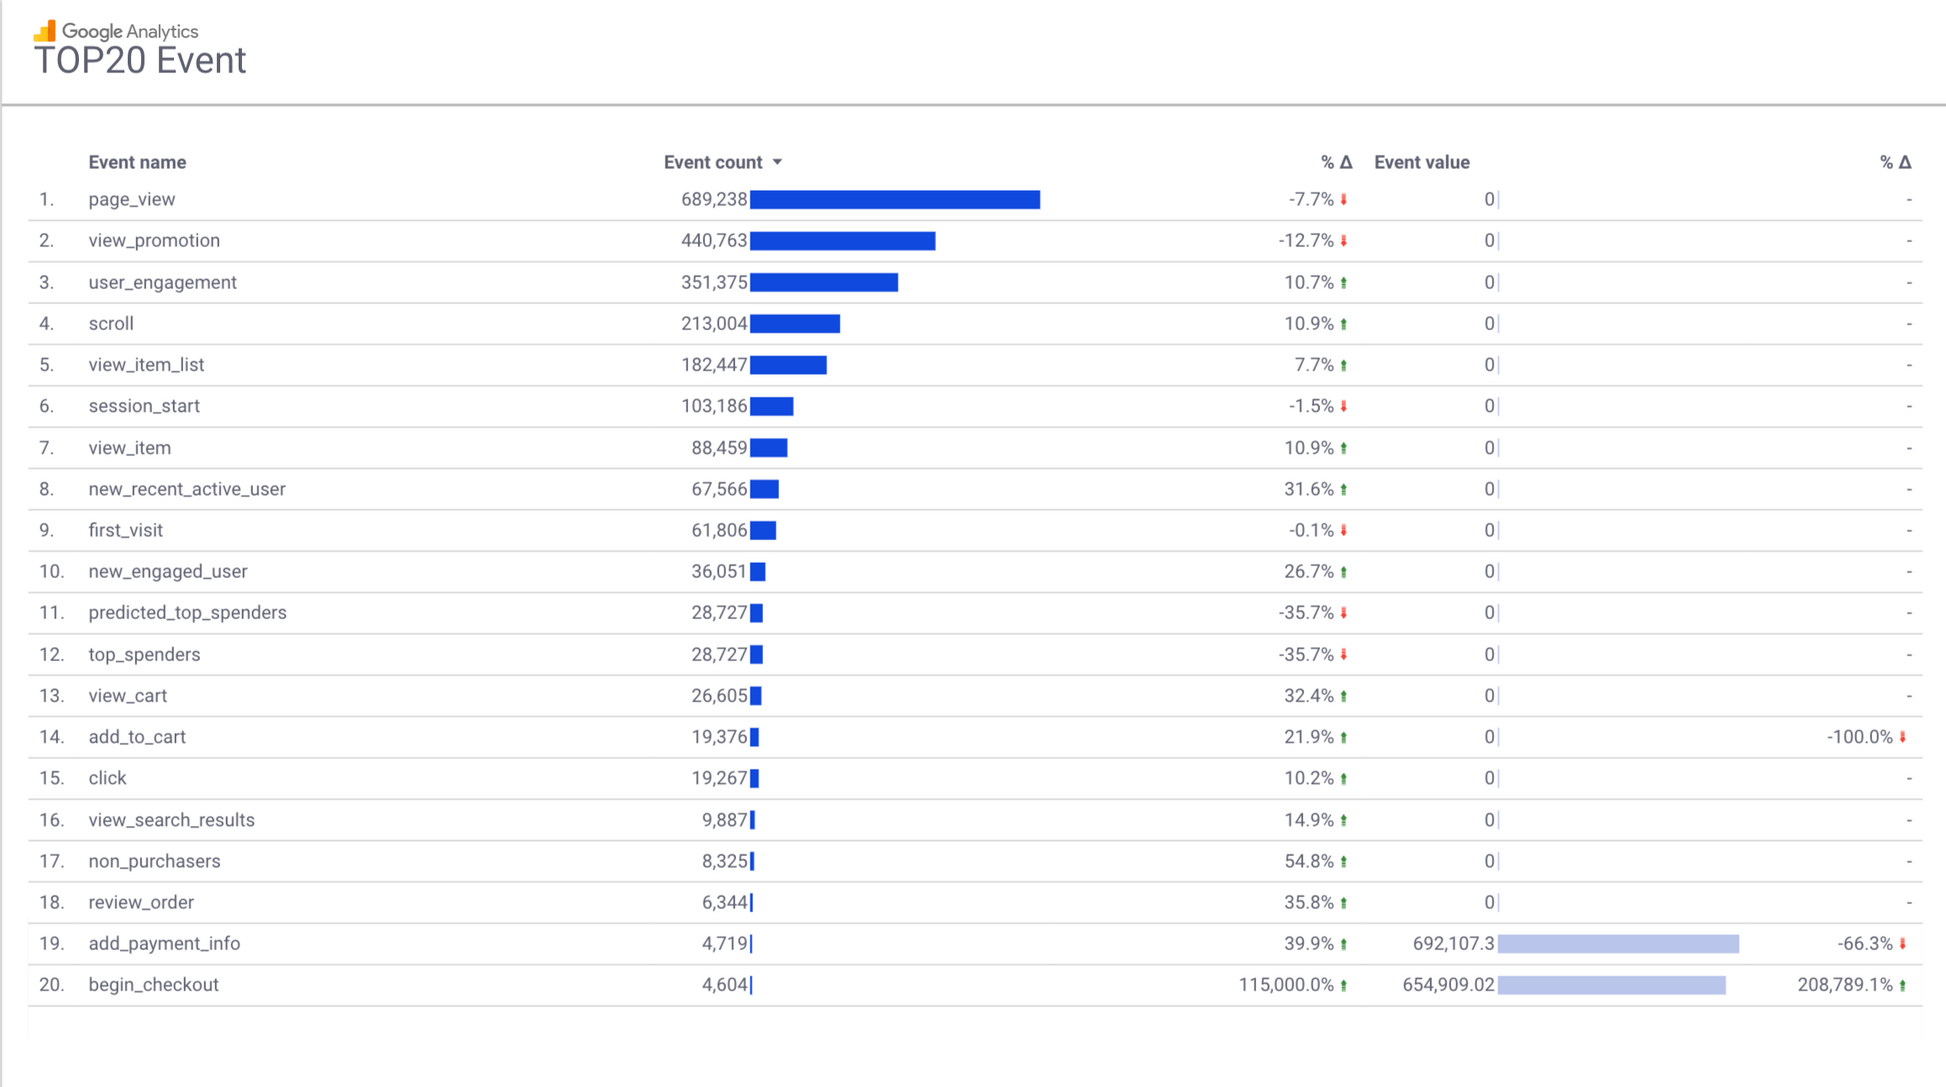
- Engagement Analysis: Page and event-specific engagement trends.
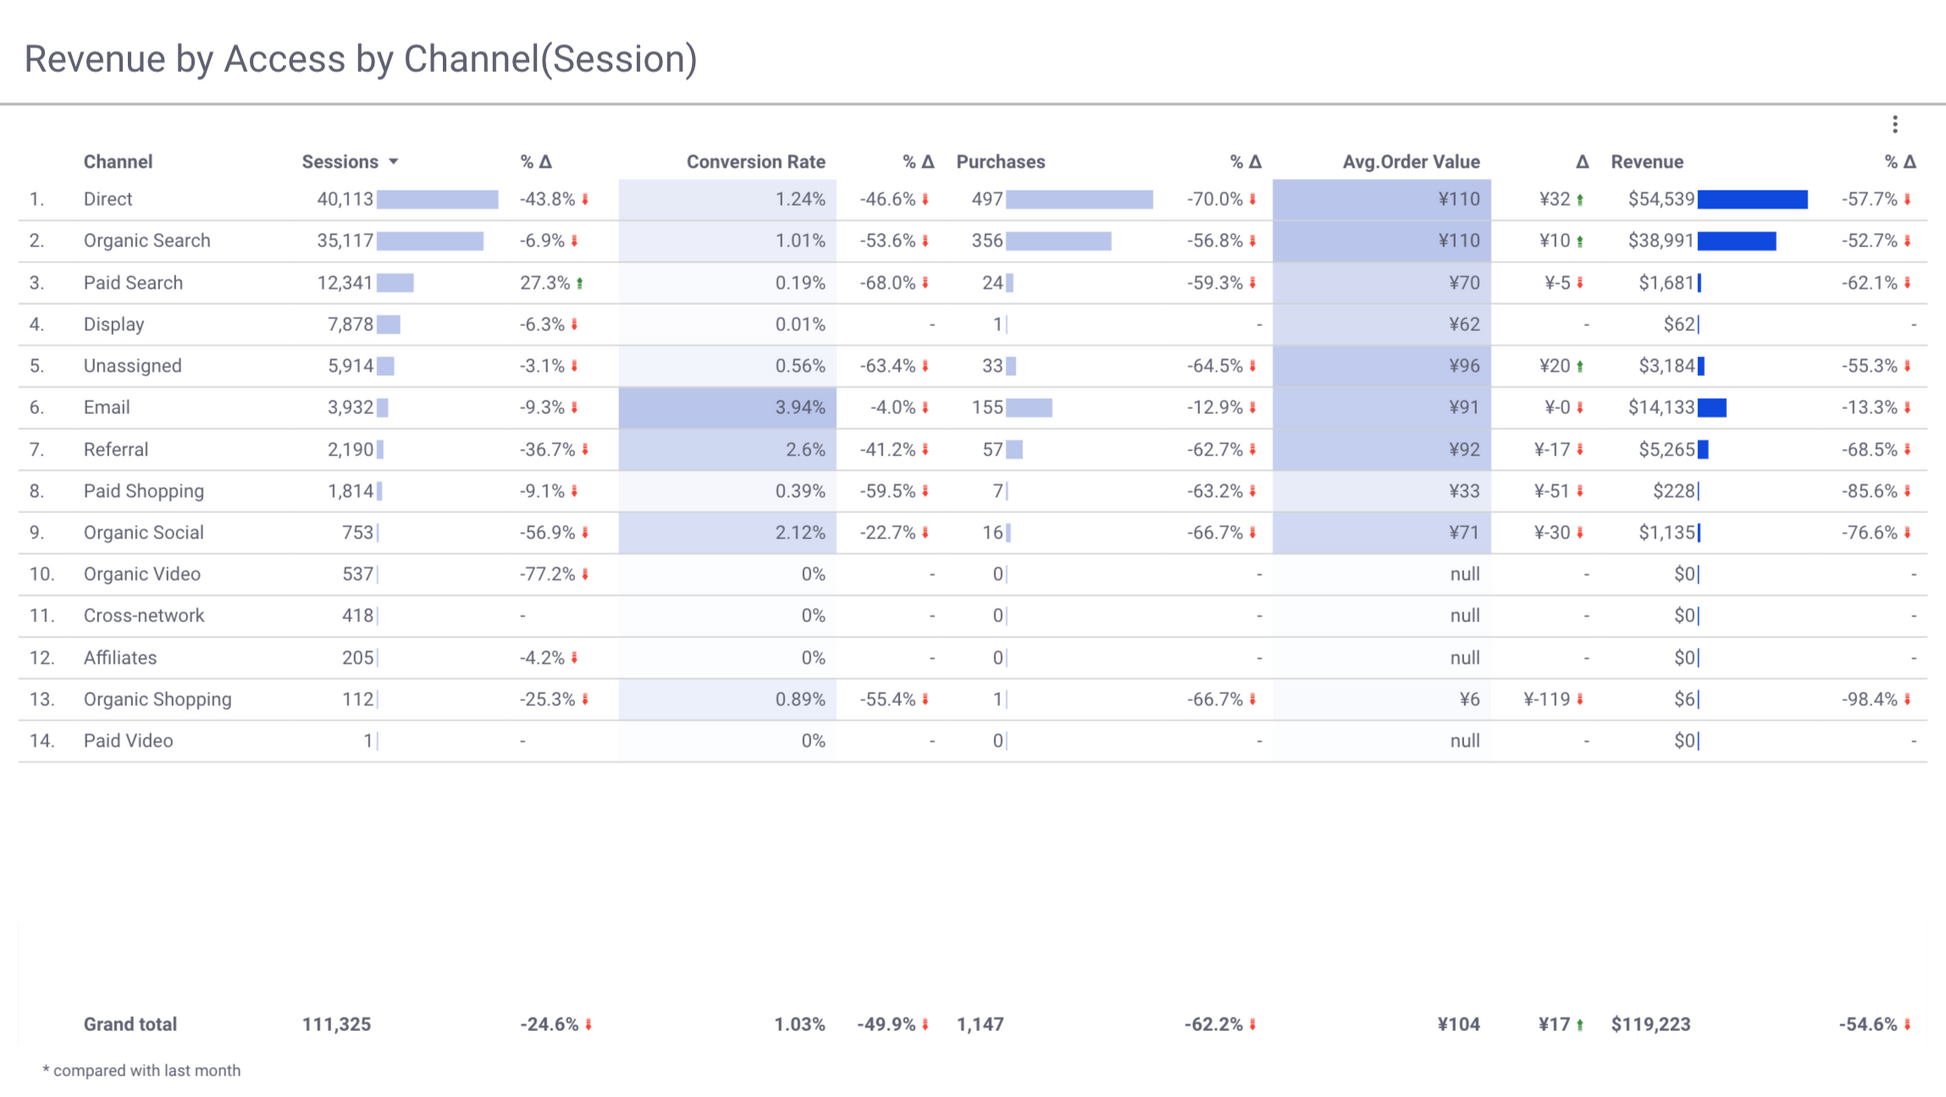
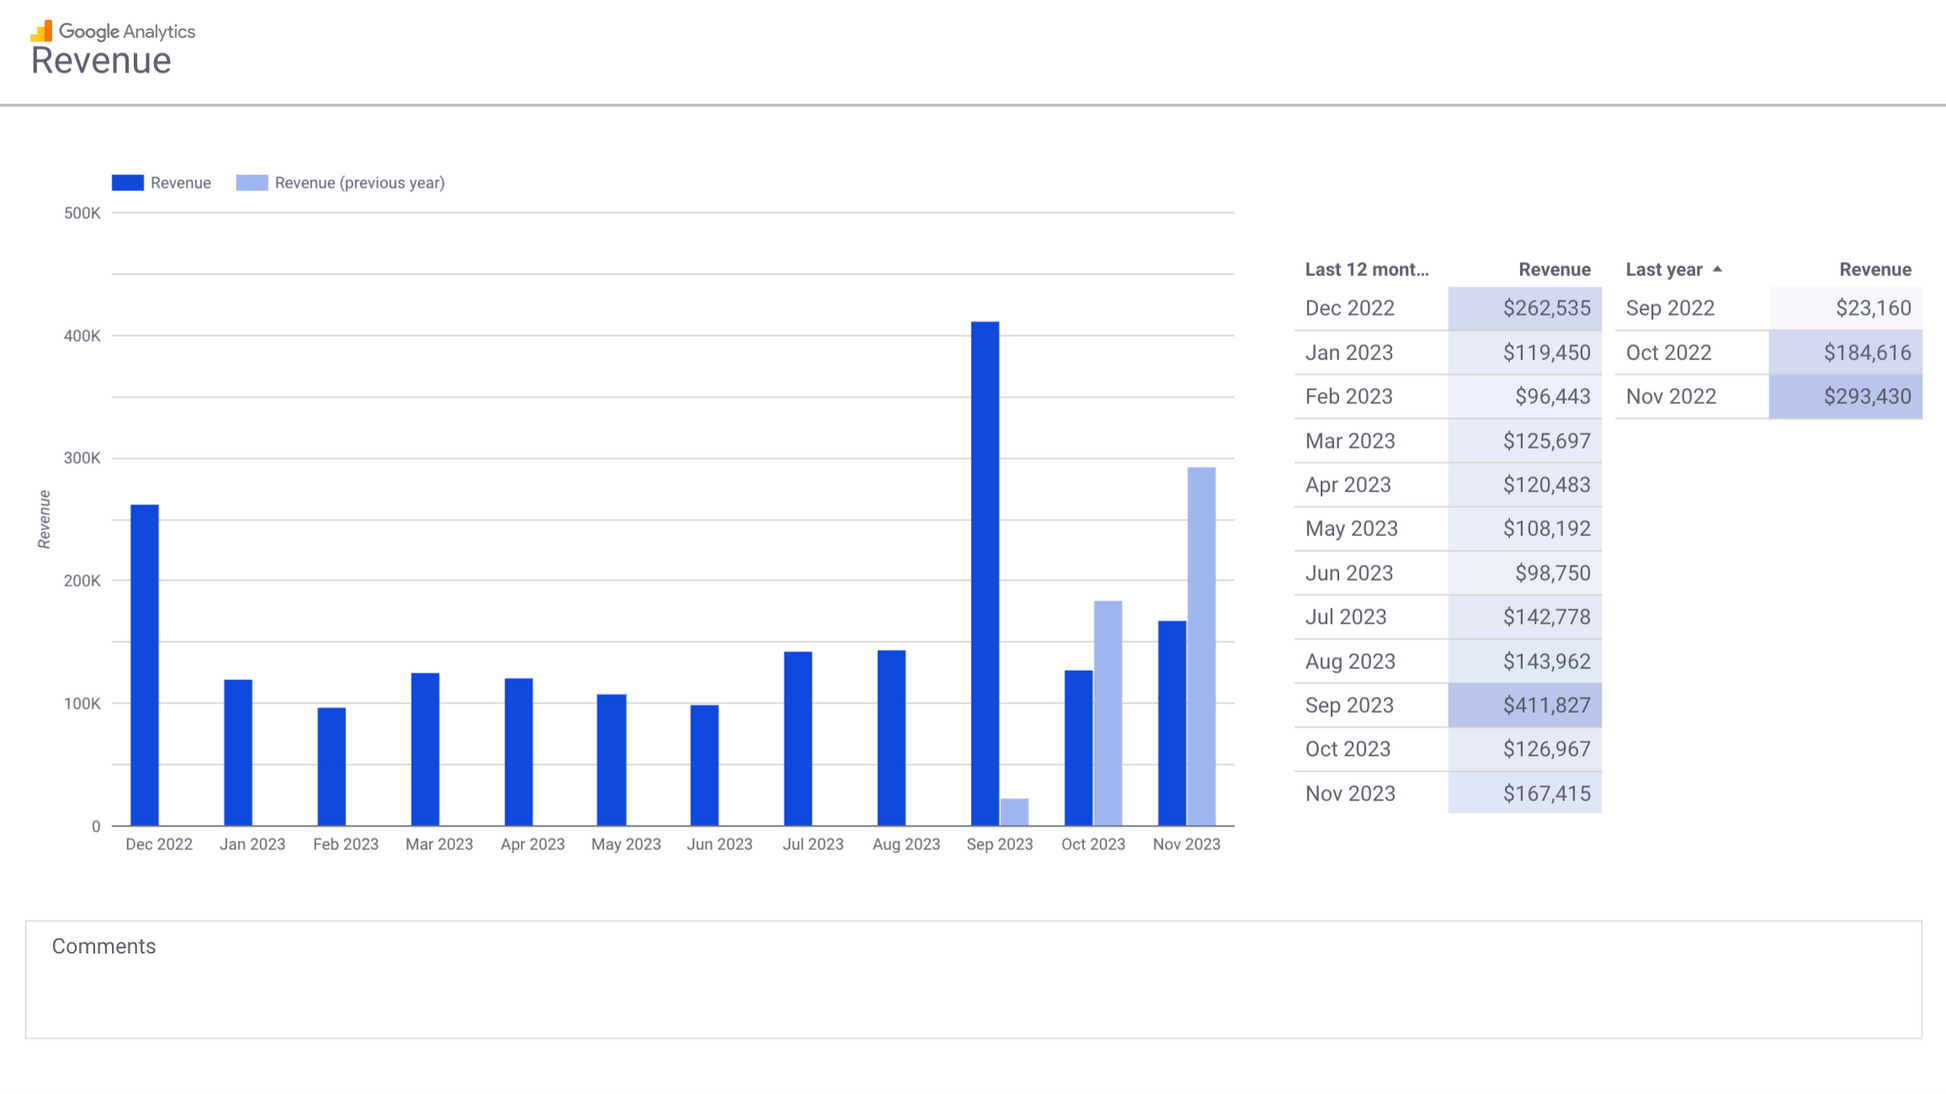
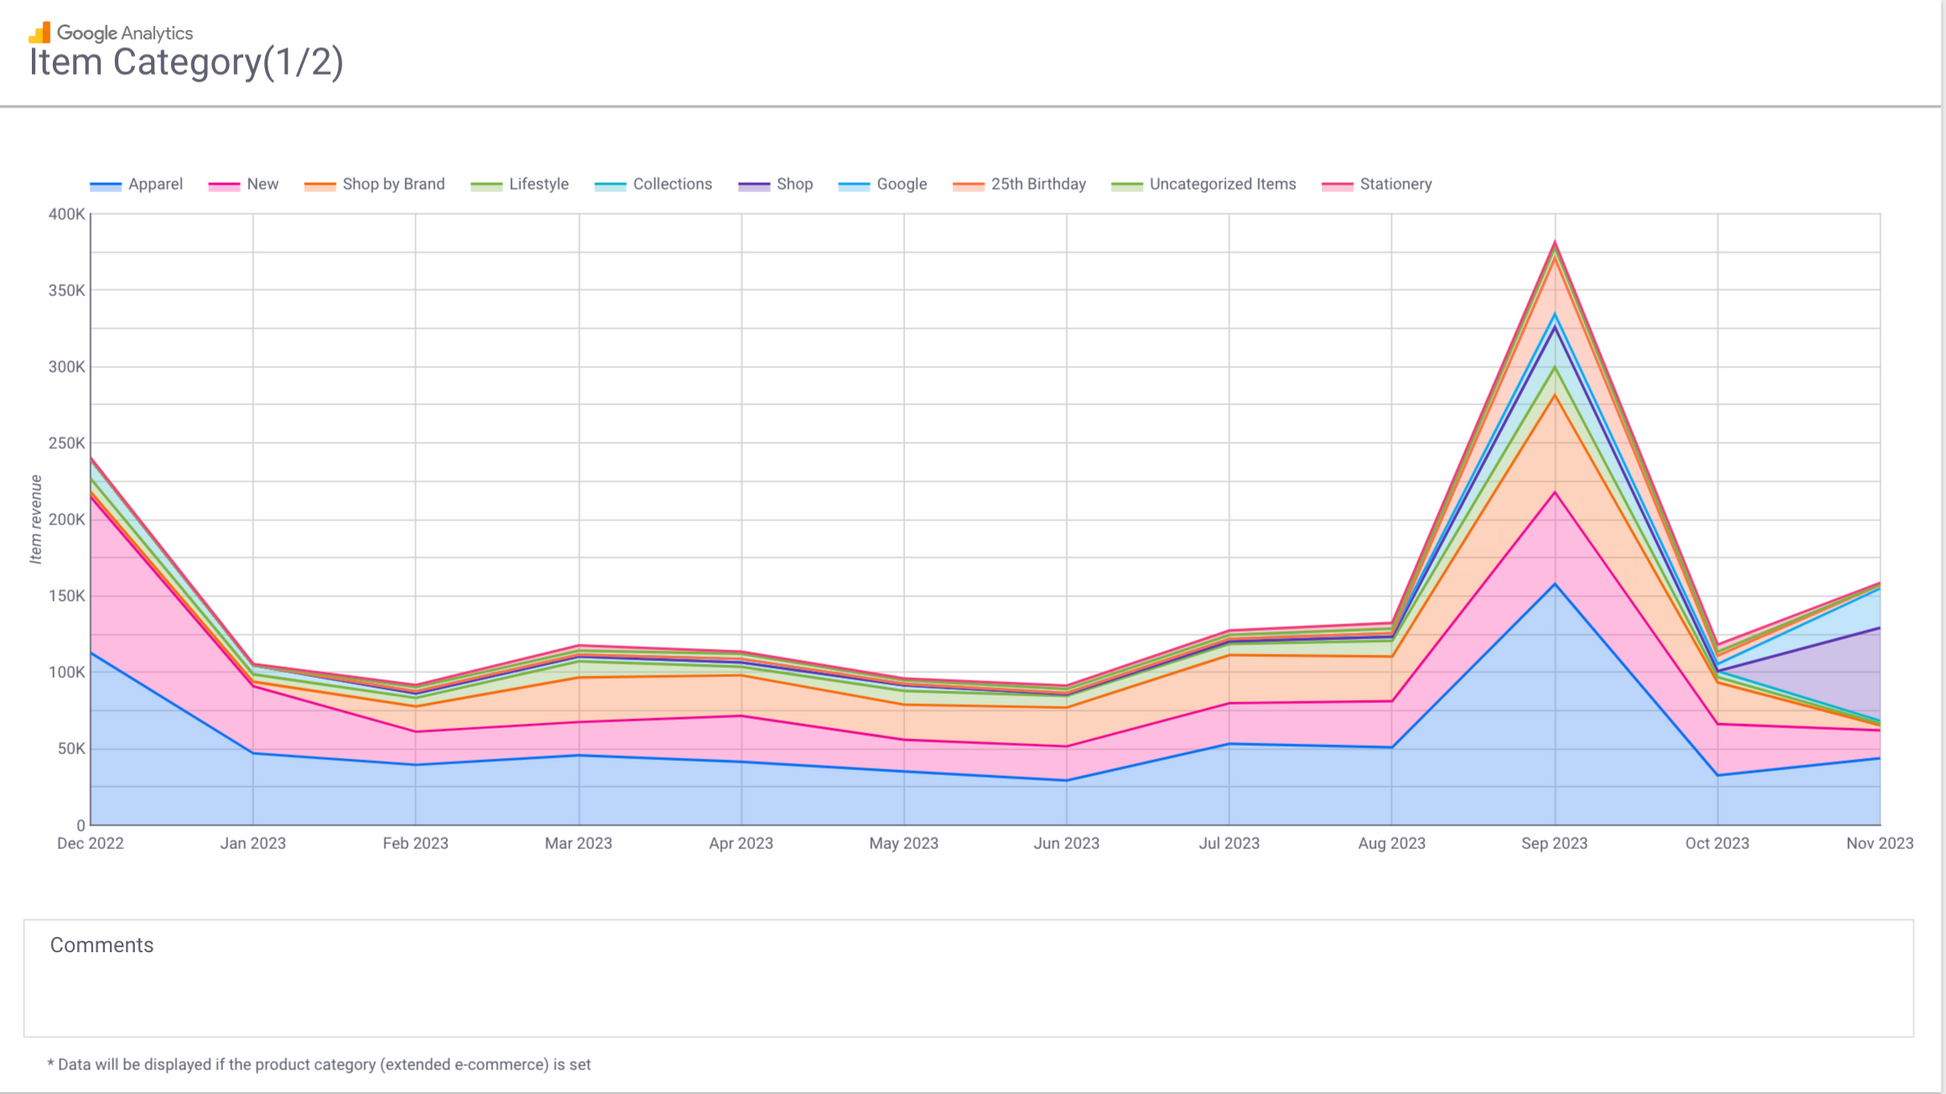
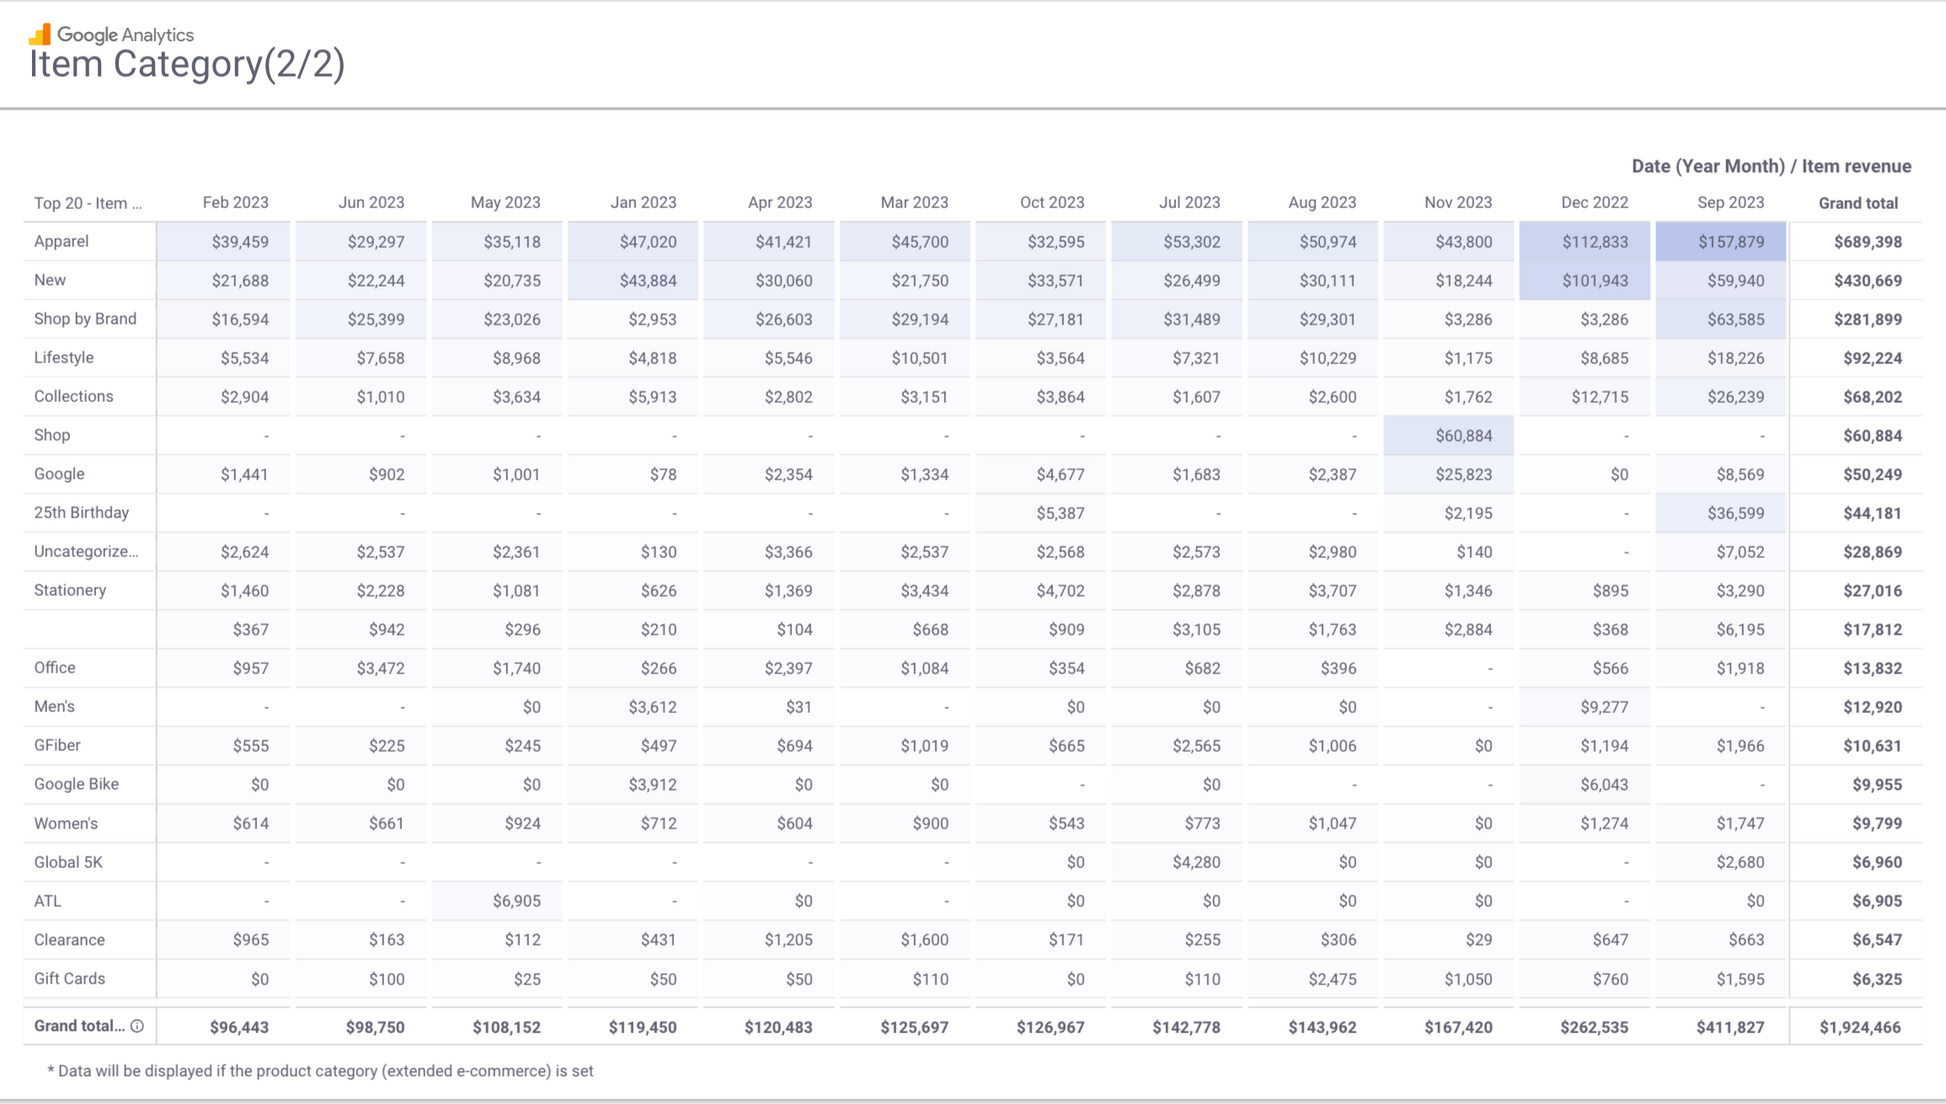
- Revenue: Revenue summary.
Metrics in Report
- Users & New Users: Tracks all active and first-time visitors.
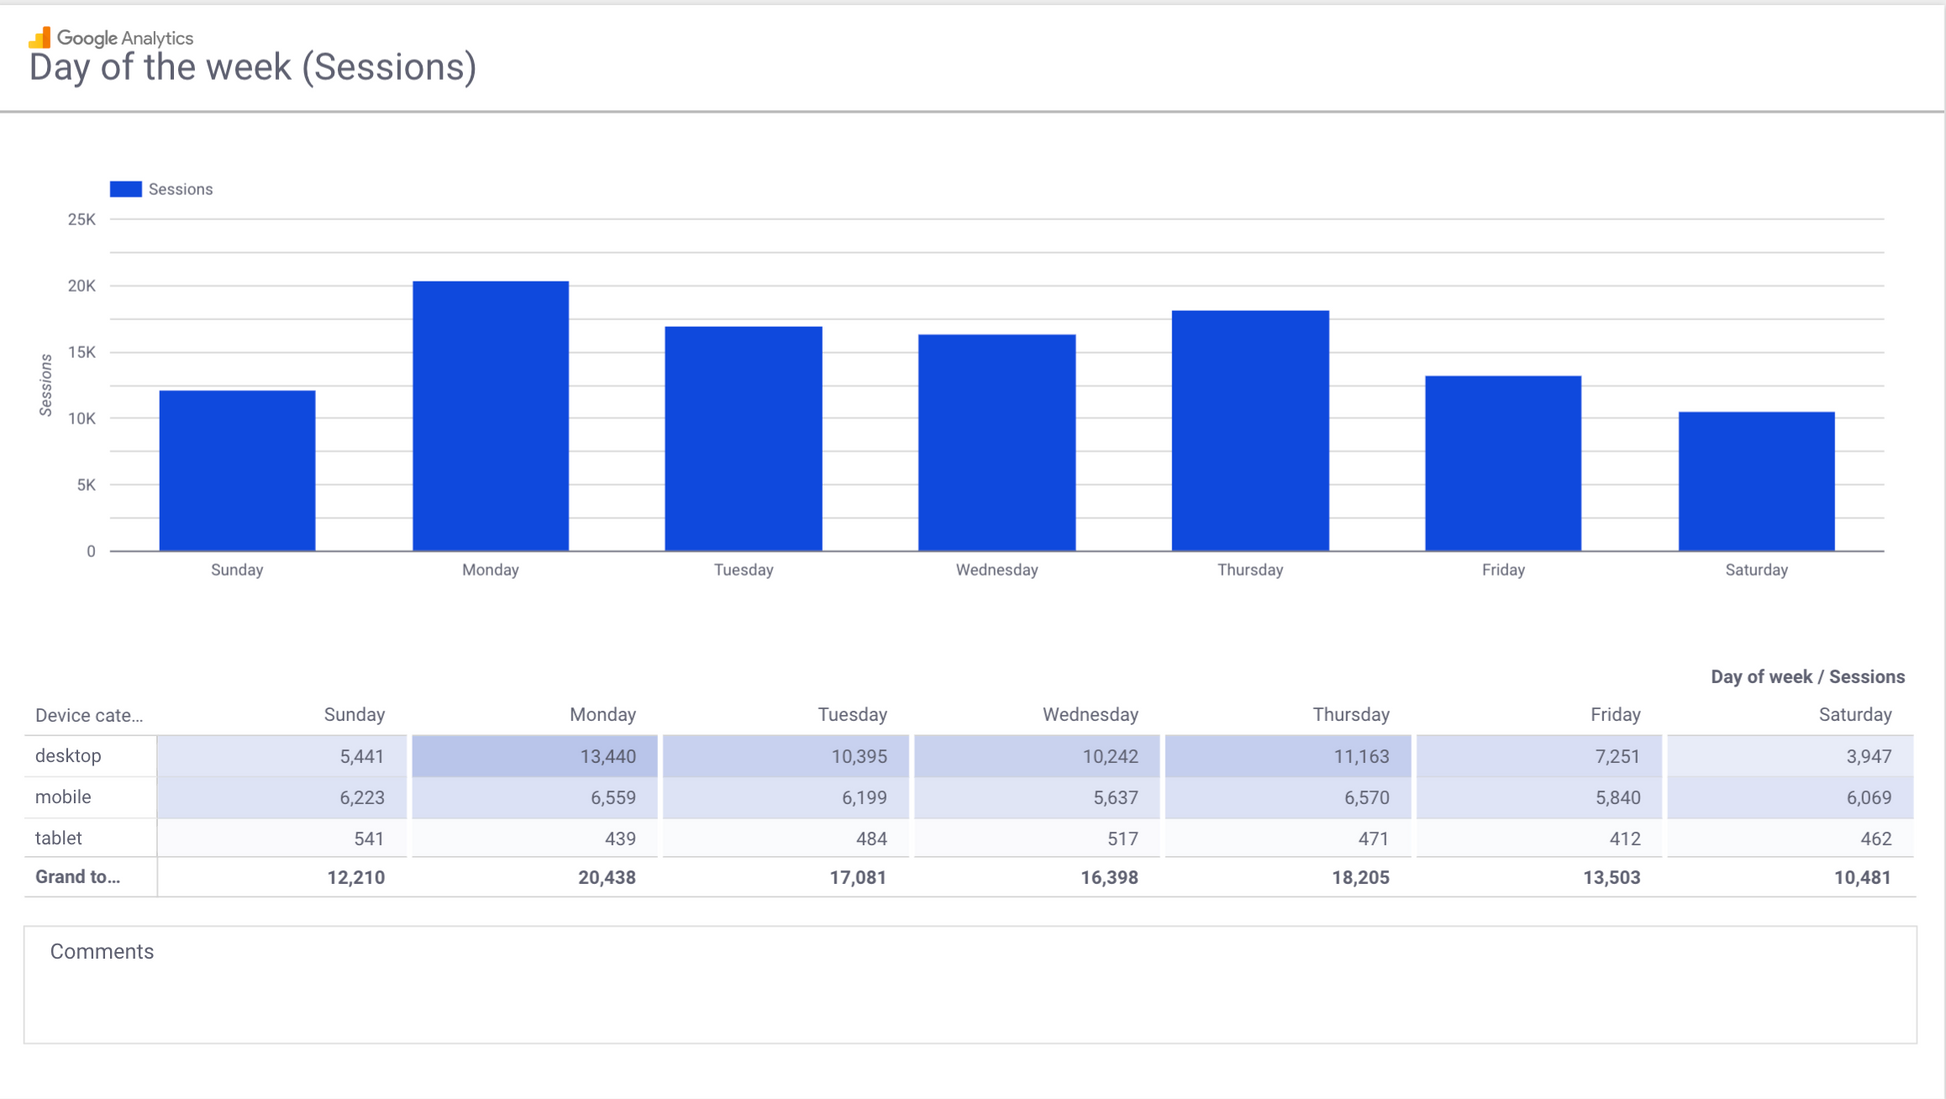
- Sessions: Measures visit frequency.
- Views (PV): Captures total views, including repeats.
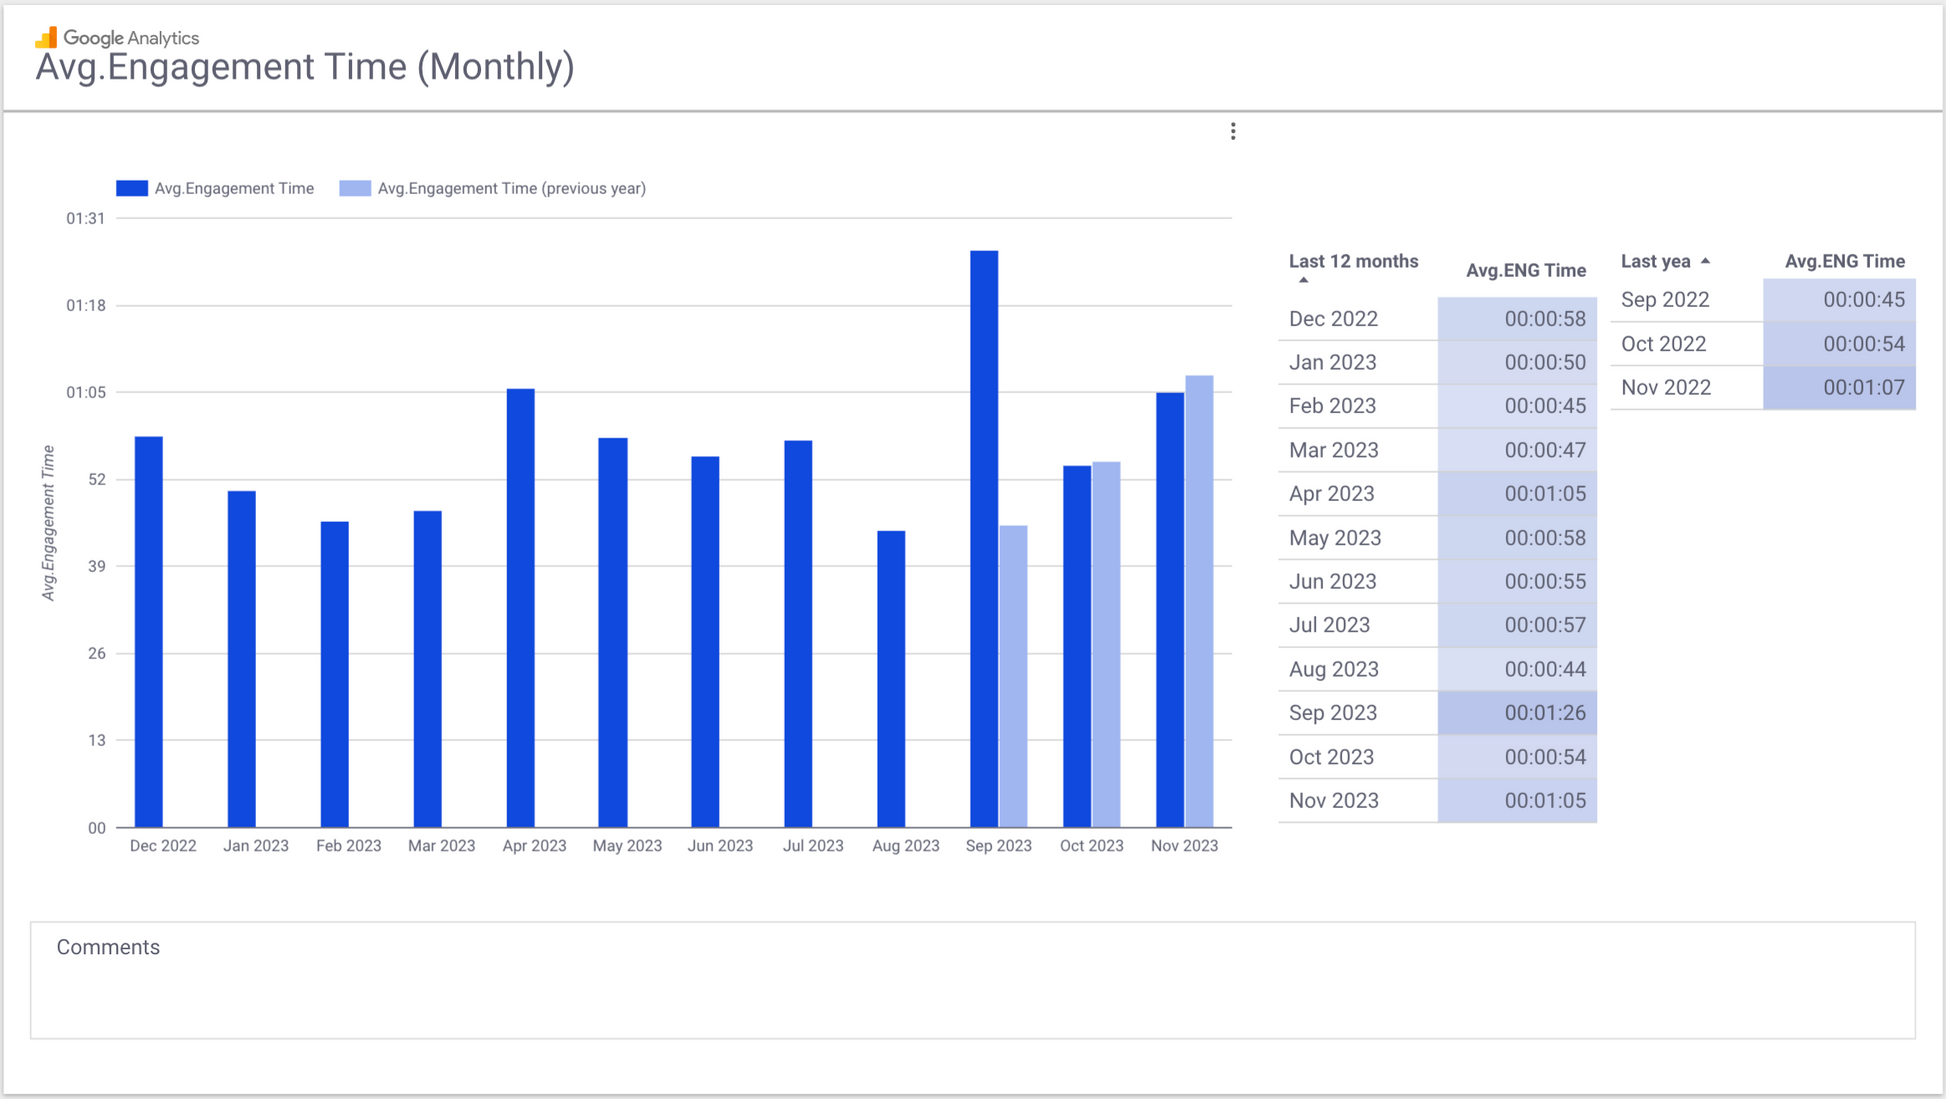
- Engagement Time & Rate: Averages and percentages indicating user interest.
- Avg.Engagement time: The average time users actively stayed on the site.
- Purchase rate: Purchase rate. Calculated as "Number of purchases" / "Sessions".
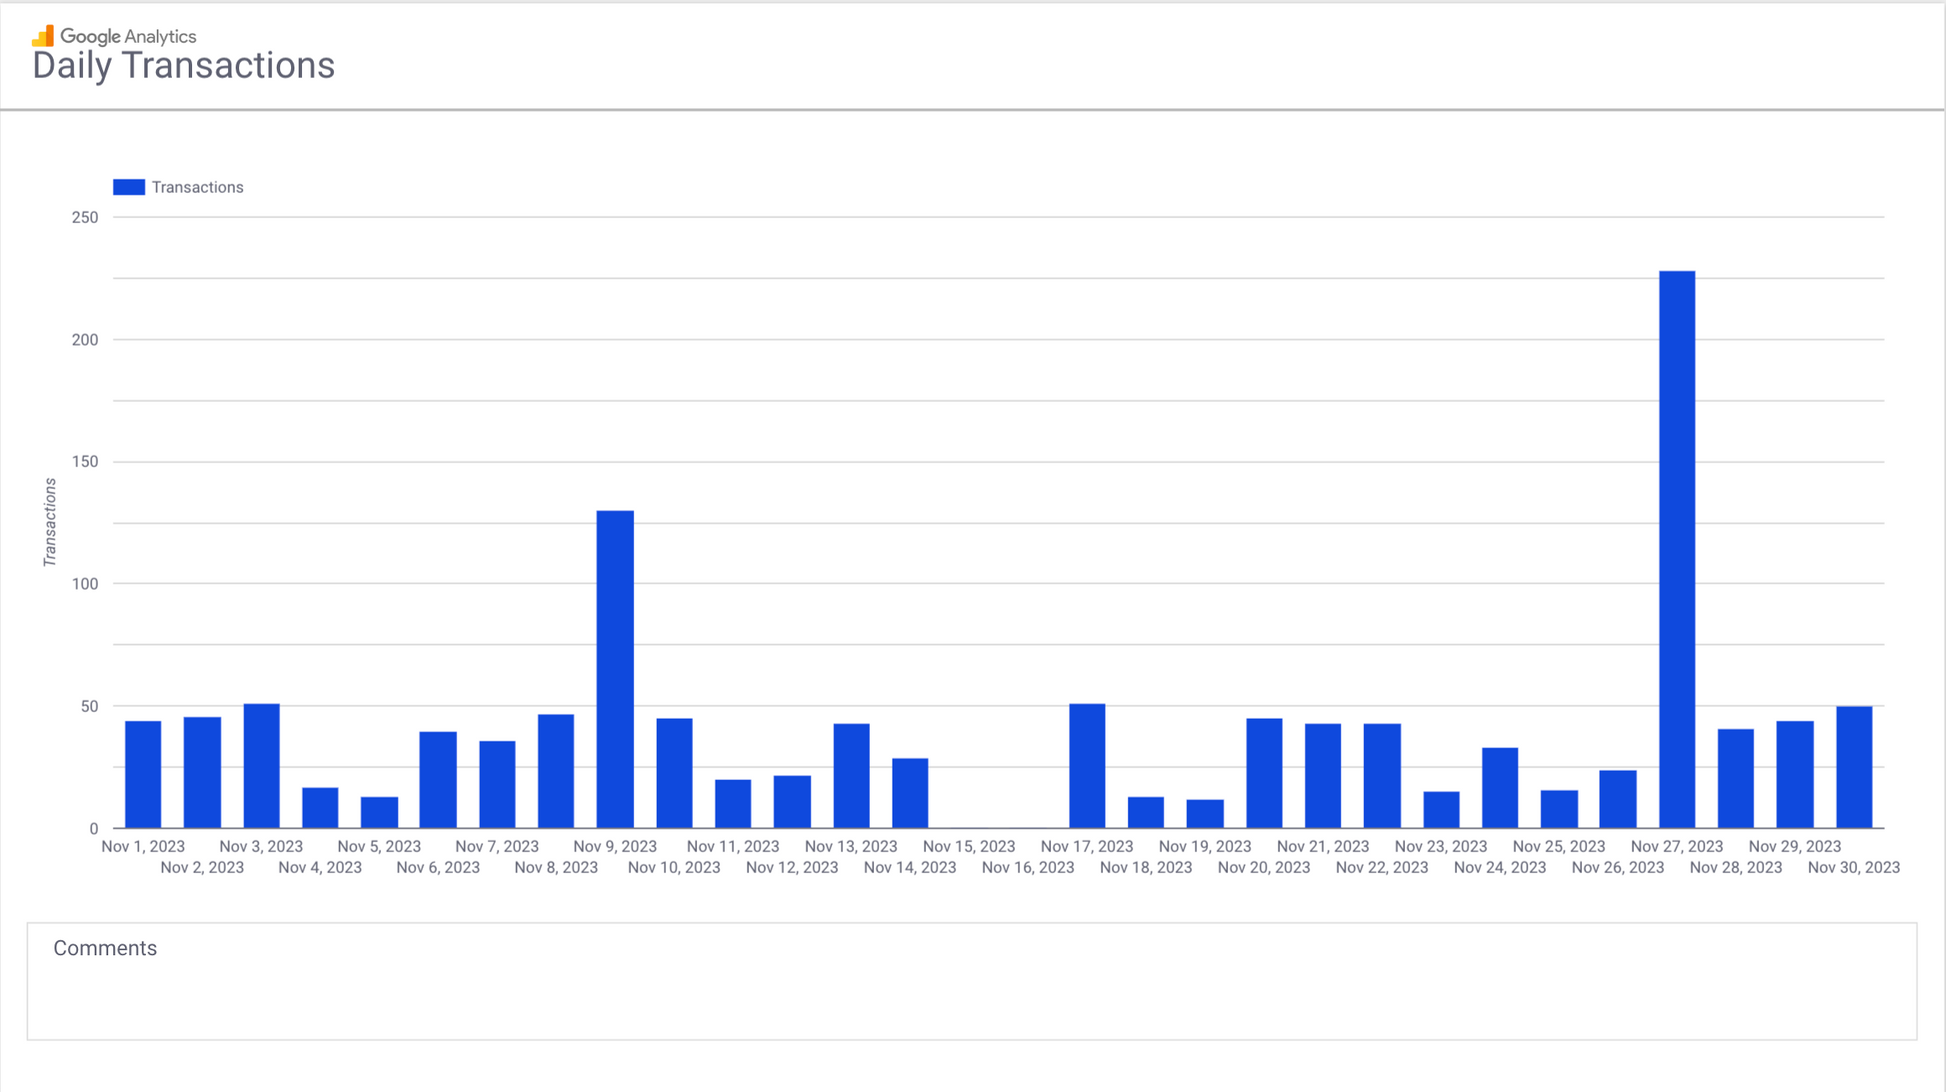
- Purchases: E commerce purchases
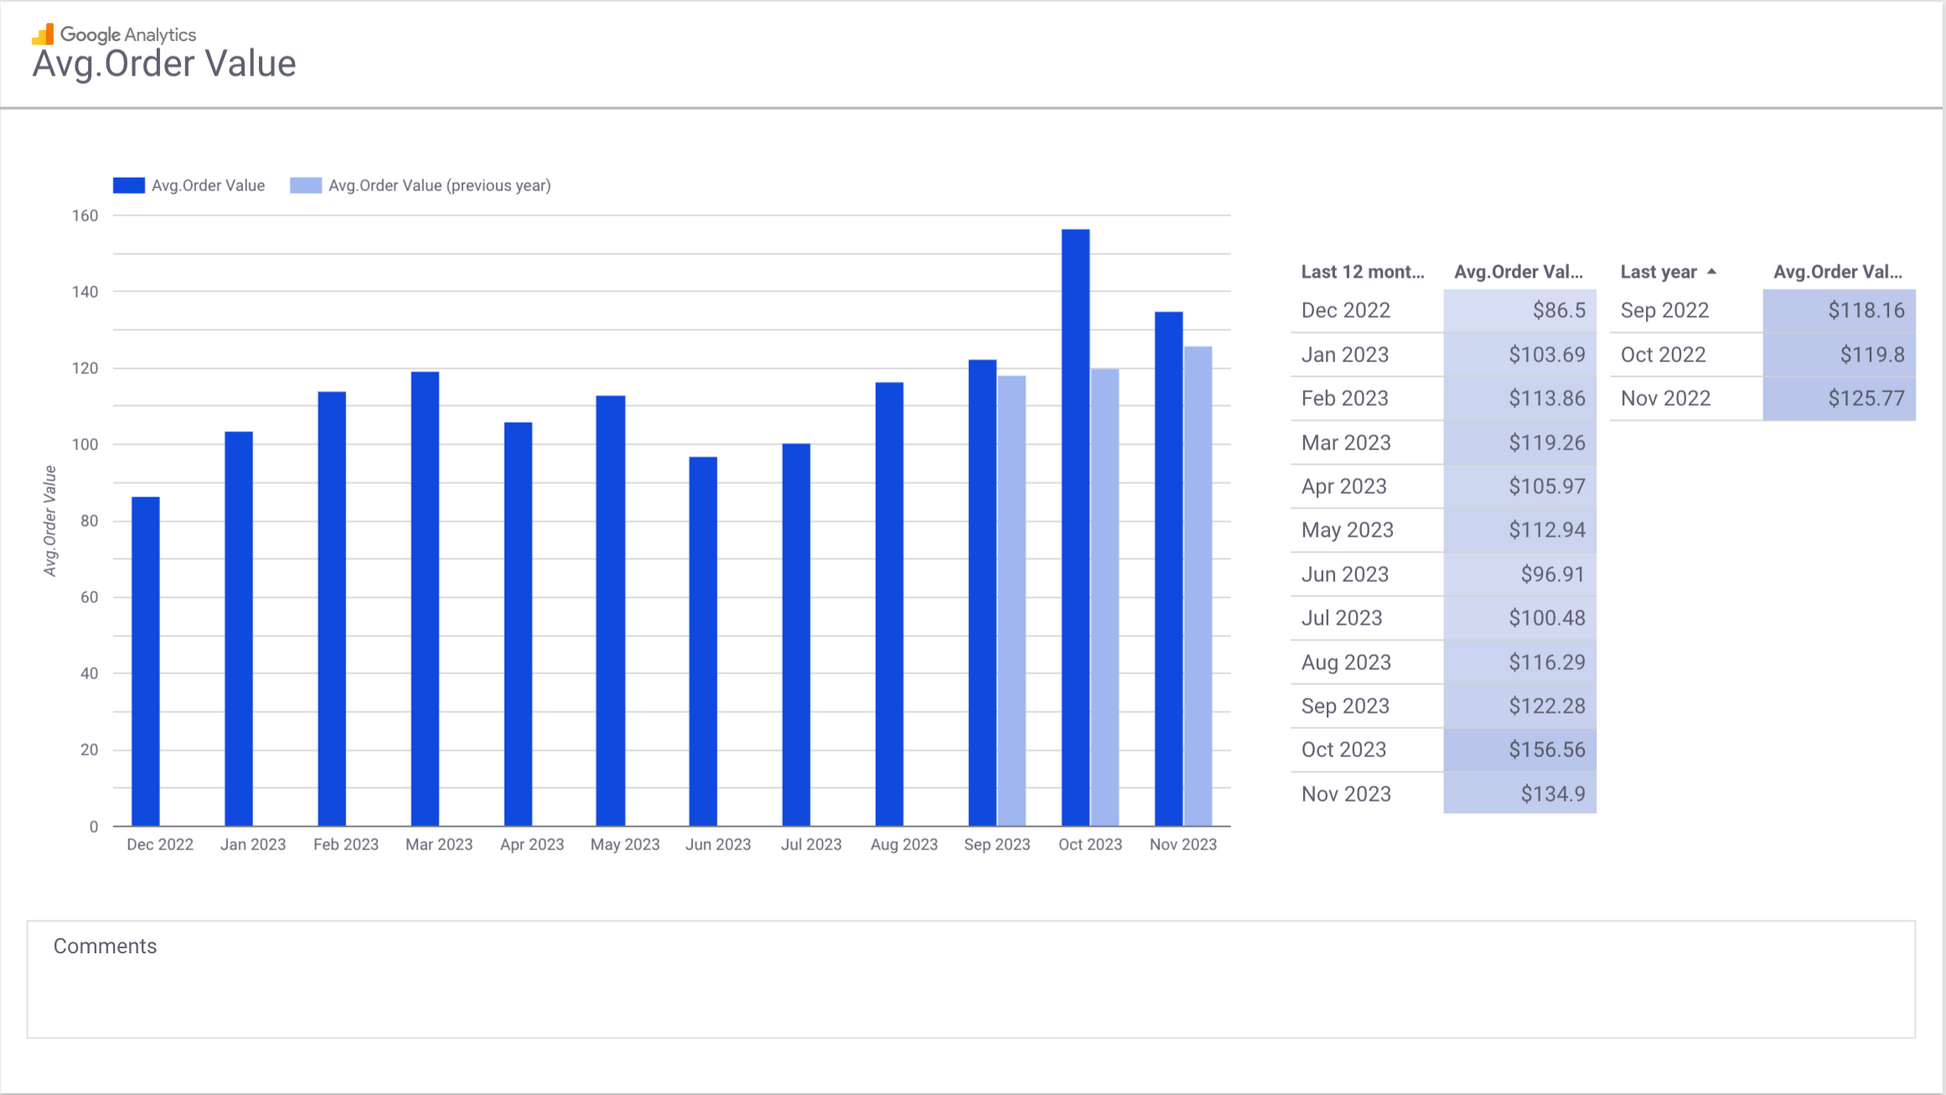
- Avg.Order Revenue: Average Revenue per Purchase
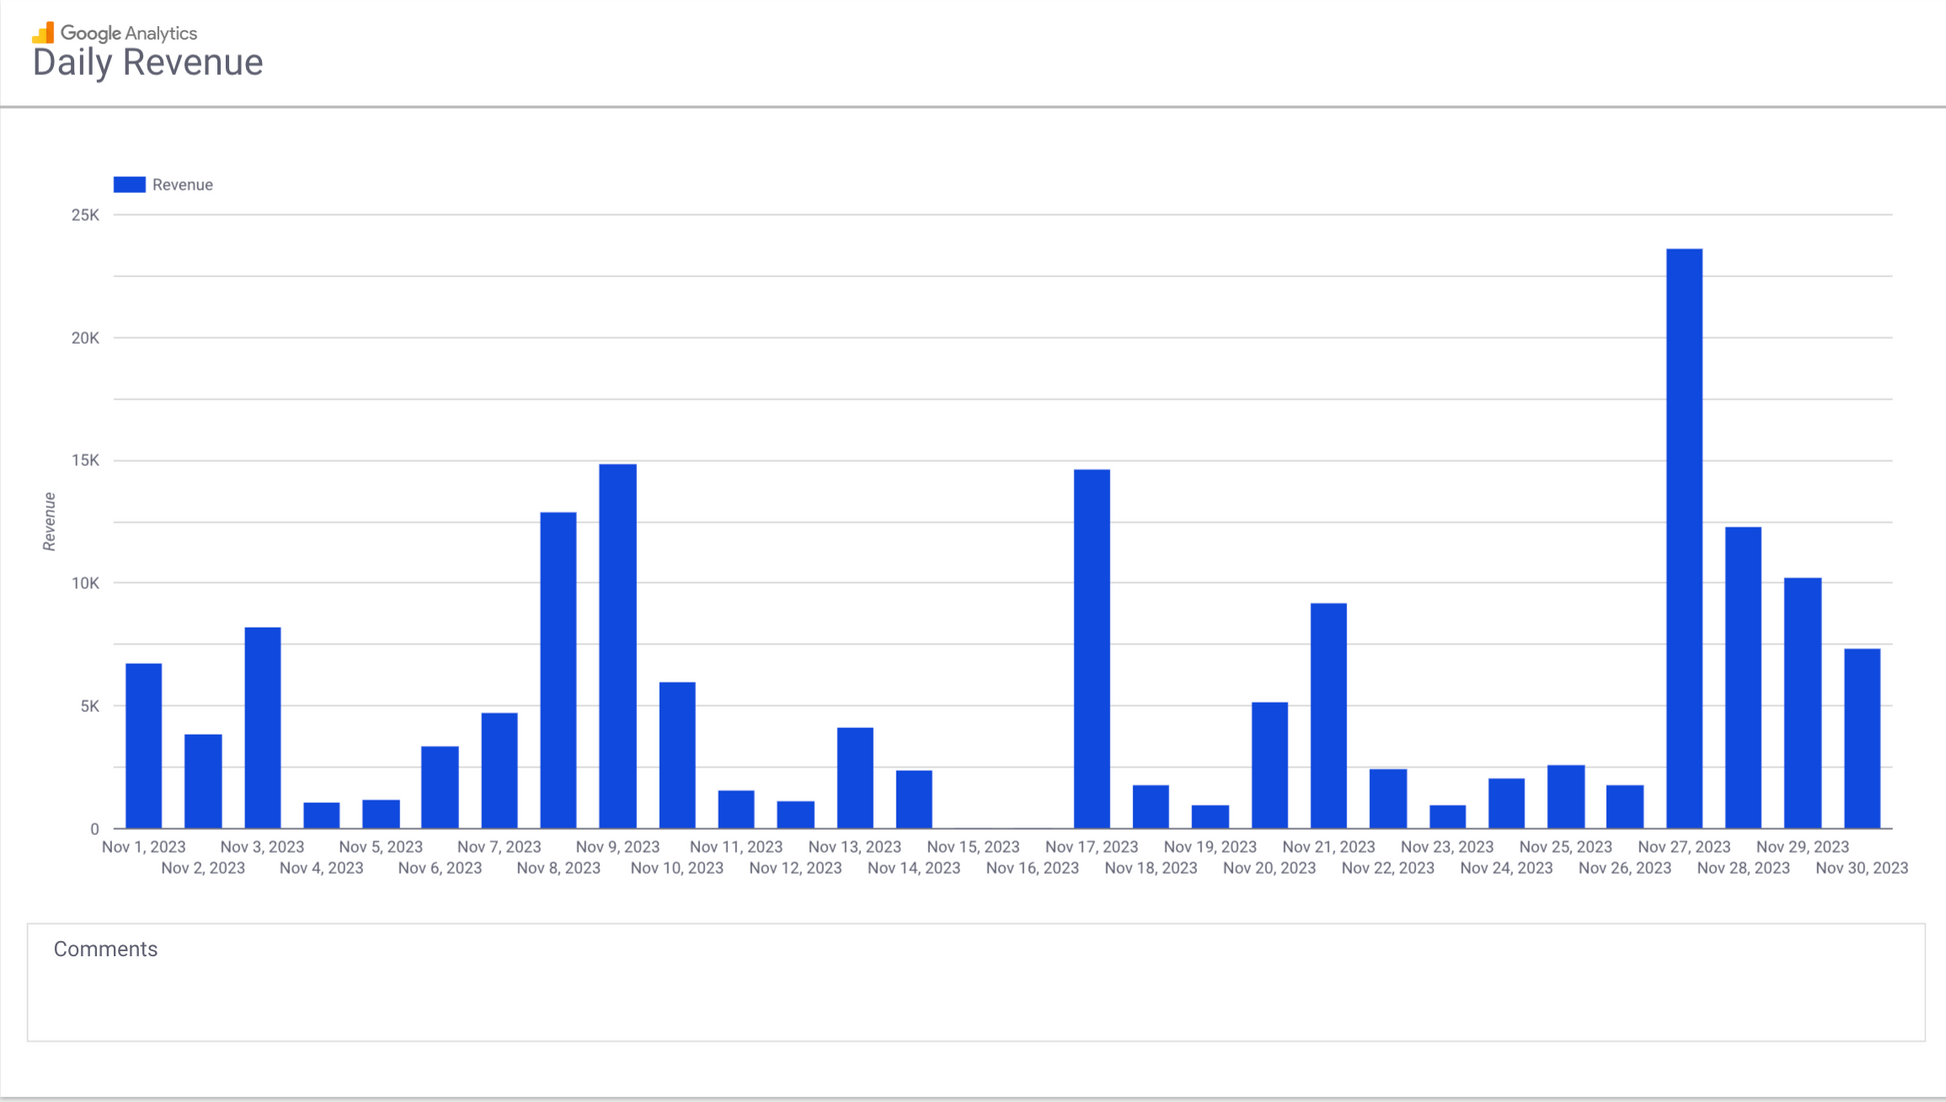
- Revenue: Purchase Revenue
- Items viewed: The number of times a product was viewed.
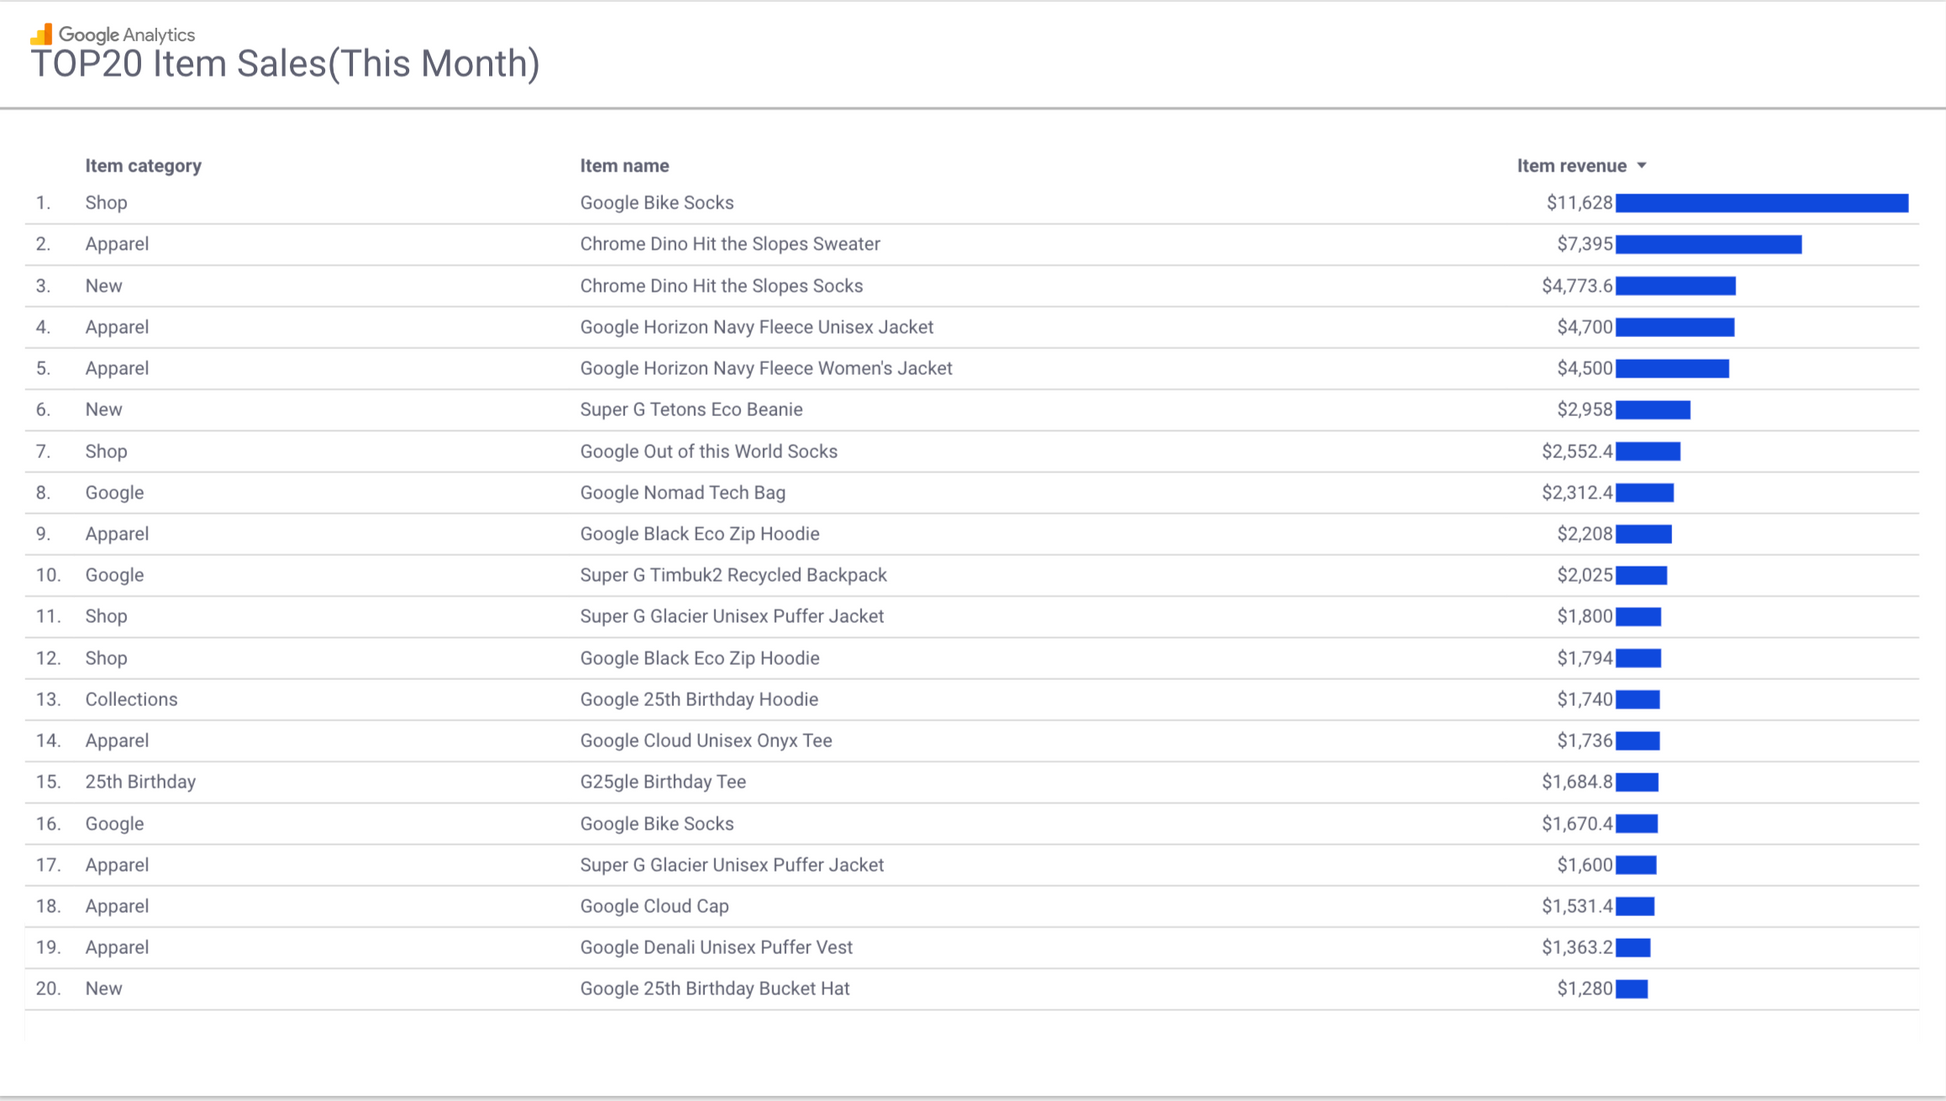
- Item revenue: This is the product revenue, calculated by multiplying the number of purchases by the price for each product.
- Item purchased: The number of products sold.
- Avg.Item revenue: This is the average product price, calculated by dividing "Product Revenue" by "Number of Products Sold.”
88studio
GA4 EC Monthly Report Template[4008]
GA4 EC Monthly Report Template[4008]
Couldn't load pickup availability
Overview
This all-in-one GA4 report template for eCommerce sites makes it easy for anyone to automate GA4 reporting and daily monitoring. With an impressive 99 pages, it covers a wide range of reporting needs (unneeded pages can be hidden). One-time purchase allows unlimited use across multiple sites. Simply copy the report to create it in just a few minutes. Freely customize the date range and layout to suit your needs.
Data Sources
- Google Analytics
Key Features
- One-Time Purchase, Lifetime Use: Pay once and get ongoing access without recurring costs.
- Unlimited Sites & Accounts: Report across unlimited sites, even those connected to different Google accounts.
- Commercial Use Approved: Charge clients for reports built with this template.
- Fully Customizable: Tailor every element to meet unique reporting needs.
- Always Updated: Our team continuously updates the template to align with GA4's latest specifications.
- GA Experts on Board: Expert advisors oversee template accuracy and functionality.
- Instant Report Generation: Copy, paste, and generate professional reports in just minutes.
Product Details
- Output: Looker Studio
- Historical Data: Unlimited
Usage
Access the template and follow the included quick-start guide to get set up in under 3 minutes. Access the guide immediately after purchase or via email.
Report Contents
- Summary & Trends: Monthly, Daily, MoM/YoY, and last 3 months' overviews, user behaviors, engagement, and conversions.
- User Analysis: Breakdowns by demographics, device, location, and more.
- Attraction & Acquisition: Detailed views of traffic sources, including organic and paid.
- SEO Metrics: Organic search data, query performance, and landing page insights.
- Engagement Analysis: Page and event-specific engagement trends.
- Revenue: Revenue summary.
Metrics in Report
- Users & New Users: Tracks all active and first-time visitors.
- Sessions: Measures visit frequency.
- Views (PV): Captures total views, including repeats.
- Engagement Time & Rate: Averages and percentages indicating user interest.
- Avg.Engagement time: The average time users actively stayed on the site.
- Purchase rate: Purchase rate. Calculated as "Number of purchases" / "Sessions".
- Purchases: E commerce purchases
- Avg.Order Revenue: Average Revenue per Purchase
- Revenue: Purchase Revenue
- Items viewed: The number of times a product was viewed.
- Item revenue: This is the product revenue, calculated by multiplying the number of purchases by the price for each product.
- Item purchased: The number of products sold.
- Avg.Item revenue: This is the average product price, calculated by dividing "Product Revenue" by "Number of Products Sold.”
![GA4 EC Monthly Report Template[4008]](http://88studio.io/cdn/shop/files/4008_75c0c108-4e41-4fee-87ec-e7c823b6939d.png?v=1743466274&width=1445)
![GA4 EC Monthly Report Template[4008]](http://88studio.io/cdn/shop/products/2023-02-1316.29.40.png?v=1743466274&width=1445)
![GA4 EC Monthly Report Template[4008]](http://88studio.io/cdn/shop/products/2023-02-1316.29.48.png?v=1743466274&width=1445)
![GA4 EC Monthly Report Template[4008]](http://88studio.io/cdn/shop/products/2023-02-1316.29.59.png?v=1743466274&width=1445)
![GA4 EC Monthly Report Template[4008]](http://88studio.io/cdn/shop/products/2023-02-1316.30.19.png?v=1743466274&width=1445)
![GA4 EC Monthly Report Template[4008]](http://88studio.io/cdn/shop/products/2023-02-1316.30.56.png?v=1743466274&width=1445)
![GA4 EC Monthly Report Template[4008]](http://88studio.io/cdn/shop/files/2023-12-0217.24.41.png?v=1743466274&width=1445)
![GA4 EC Monthly Report Template[4008]](http://88studio.io/cdn/shop/files/2023-12-0217.24.50.png?v=1743466274&width=1445)
![GA4 EC Monthly Report Template[4008]](http://88studio.io/cdn/shop/files/2023-12-0217.24.59.png?v=1743466274&width=1445)
![GA4 EC Monthly Report Template[4008]](http://88studio.io/cdn/shop/files/2023-12-0217.25.09.png?v=1743466274&width=1445)
![GA4 EC Monthly Report Template[4008]](http://88studio.io/cdn/shop/files/2023-12-0217.25.17.png?v=1743466274&width=1445)
![GA4 EC Monthly Report Template[4008]](http://88studio.io/cdn/shop/files/2023-12-0217.25.30.png?v=1743466274&width=1445)
![GA4 EC Monthly Report Template[4008]](http://88studio.io/cdn/shop/files/2023-12-0217.25.39.png?v=1743466274&width=1445)
![GA4 EC Monthly Report Template[4008]](http://88studio.io/cdn/shop/files/2023-12-0217.25.50.png?v=1743466274&width=1445)
![GA4 EC Monthly Report Template[4008]](http://88studio.io/cdn/shop/files/2023-12-0217.26.02.png?v=1743466274&width=1445)
![GA4 EC Monthly Report Template[4008]](http://88studio.io/cdn/shop/files/2023-12-0217.26.13.png?v=1743466274&width=1445)
![GA4 EC Monthly Report Template[4008]](http://88studio.io/cdn/shop/files/2023-12-0217.26.22.png?v=1743466274&width=1445)
![GA4 EC Monthly Report Template[4008]](http://88studio.io/cdn/shop/files/2023-12-0217.26.36.png?v=1743466274&width=1445)
![GA4 EC Monthly Report Template[4008]](http://88studio.io/cdn/shop/files/2023-12-0217.26.46.png?v=1743466274&width=1445)
![GA4 EC Monthly Report Template[4008]](http://88studio.io/cdn/shop/files/2023-12-0217.26.57.png?v=1743466274&width=1445)
![GA4 EC Monthly Report Template[4008]](http://88studio.io/cdn/shop/files/2023-12-0217.27.13.png?v=1743466274&width=1445)
![GA4 EC Monthly Report Template[4008]](http://88studio.io/cdn/shop/files/2023-12-0217.27.23.png?v=1743466274&width=1445)
![GA4 EC Monthly Report Template[4008]](http://88studio.io/cdn/shop/files/2023-12-0217.27.32.png?v=1743466274&width=1445)
![GA4 EC Monthly Report Template[4008]](http://88studio.io/cdn/shop/files/2023-12-0217.27.43.png?v=1743466274&width=1445)
![GA4 EC Monthly Report Template[4008]](http://88studio.io/cdn/shop/files/2023-12-0217.28.00.png?v=1743466274&width=1445)
![GA4 EC Monthly Report Template[4008]](http://88studio.io/cdn/shop/files/2023-12-0217.28.15.png?v=1743466274&width=1445)

