| Feature |
Calculated Fields in Data Sources |
Chart-Specific Calculated Fields |
| Who can create |
Editors of the data source |
Editors of the report |
| Scope of use for the created calculated fields |
All reports using that data source |
Only the chart for which they were created |
| Creating calculated fields using other calculated fields |
Possible |
Not possible |
| Handling integrated data |
Not possible |
Possible |
What You Can Do with Looker Studio's Calculated Fields
The capabilities of using calculated fields can be broadly categorized into the following three:
- Creating new metrics using numbers and standard operators (addition, subtraction, multiplication, division)
- Processing data using functions
- Creating branching logic using CASE statements
Understanding these may seem abstract, so in the following sections, we will introduce specific ways to use calculated fields and practical examples using handy functions. Please consider them as references.
How to Use Looker Studio's calculated field
Calculated fields can be easily created in three steps. Here, we will try to create a "new user rate," which is not a default metric, using the GA4 data source.
Select "Add calculated field" from the data source
Open the Looker Studio data source, click "Add Field" at the top right, and then you will see two options. Choose "Add calculated field."

Enter "Field Name" and "Formula," then save
Set it as follows and save. Note that these settings can be changed later.
- Field Name: Enter a name that is easy to understand later
- Formula: For the new user rate, enter "number of new users / number of active users"

(Optional) Change the type
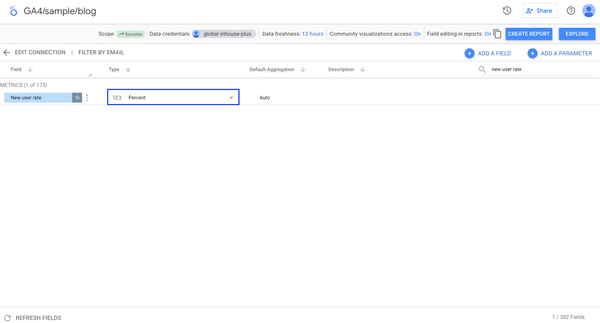
After saving, close the settings screen, and the list of fields will be displayed. If you enter the "new user rate" that you just set in the search box at the top right, the item you created will be displayed as follows.
The default type is numerical (e.g., 0.5), but since you want to display the new user rate as a percentage (50%), change the type to "%" using the dropdown menu.

This completes the setup for the calculated field. Once the setup is complete, the item can be used in reports immediately as shown below.

List of Useful Functions for Calculated Fields in Looker Studio
Here, we introduce a list of useful functions for creating calculated fields.
The "HYPERLINK" function that can generate a link URL from text data
The HYPERLINK function converts text into a clickable hyperlink. The basic syntax is as follows:
HYPERLINK("URL", "Link Text")
-
"URL" specifies the address of the hyperlink destination. This is the webpage URL that opens when clicked.
-
"Link Text" is the text displayed on the link. This is visible to the user, and clicking on it will take them to the specified URL.
Example of use: Creating a list of page titles with links in GA4 in Looker Studio
Set up the calculated field as follows:
HYPERLINK(Full page URL, Page title)

Using this in an actual report creates a list of clickable page titles, and clicking on one opens the actual URL in a new window.

The 'REGEXP_REPLACE' function that can transform or delete text matching certain conditions into another string
The REGEXP_REPLACE function replaces text within a string that matches a regular expression pattern with another string. The basic syntax is as follows.
REGEXP_REPLACE(target_string, 'pattern_to_search', 'replacement_string')
- target_string: The original text you want to modify.
- 'pattern_to_search': Parts matching this pattern within the target string are searched for.
-
'replacement_string': The text that matches is replaced with this string.
Example use: Excluding parameters from the full URL of a page in Looker Studio
Set up a calculated field as follows. This function removes all characters following the '?' symbol from the full URL of the page.
REGEXP_REPLACE(full page URL, '\?.+', '')

This makes the 'full page URL' dimension, with parameters excluded, available for use.

The "CASE" function that can transform data based on specific conditions
The CASE function can be utilized in various cases, such as data classification, labeling, and transforming data based on specific conditions. For instance, when categorizing products by price range, you would set it up as follows:
CASE
WHEN price < 100 THEN "Inexpensive"
WHEN price BETWEEN 100 AND 500 THEN "Standard"
WHEN price > 500 THEN "Expensive"
ELSE "Price Undefined"
END
In this example, if the price is less than 100, it is labeled "Inexpensive", the range between 100 and 500 is "Standard", and above 500 is "Expensive". If none of the conditions are met, it displays as "Price Undefined".
Use case: Converting GA4 Device Categories in Looker Studio
The device categories in GA4 are, by default, classified as follows:
By setting up calculated fields, we can convert each category as follows:
CASE
WHEN Device category = "desktop" THEN "Not mobile"
WHEN Device category = "mobile" THEN "mobile"
WHEN Device category = "tablet" THEN "Not mobile"
ELSE "other"
END

With this, you now have access to your own custom device categories.

Related Looker Studio Official Documentation
Looker Studio Official Help: About calculated fields
Looker Studio Official Help: Function List
We also recommend this article.
[Looker Studio]How to download the report as PDF
The function to download reports as PDFs in Looker Studio (formerly Data Studio) is very useful for sharing reports internally and externally as reporting materials, or printing them on paper for use as presentation materials. This article provides an easy-to-understand explanation of how to use and what to expect from the PDF download function.
How to represent GA4 content groups in Looker Studio
GA4 content group is a grouping of specific content within a site. For example, you can group content by blog category, site menu, etc. This allows you to analyze visitor preferences and parts of your site. Normally, content groups are set up using Google tag manager, but Looker Studio offers a similar setup, so if you cannot use Google tag manager but want to group pages, try this.
[Looker Studio] How to export data from a graph to a Google Spreadsheet or CSV (Excel)
Looker Studio (formerly Data Studio) allows you to export the graphs you create in a variety of formats. This article provides a clear explanation of the benefits, usage, and caveats of the export function.

![[Looker Studio] How to Use Calculated Fields | With a Handy List of Functions for Copy and Paste](http://88studio.io/cdn/shop/articles/1280_x_450_px_fdb9cb43-9a07-4ea1-a48d-62017254f994.png?v=1707712542&width=1100)


![GA4 Summary Report Template[4013]](http://88studio.io/cdn/shop/files/4013thumbnail.png?v=1733209235&width=533)
![GA4 Monthly Report Template[4007]](http://88studio.io/cdn/shop/files/4007_GA4-monthly-report-firstview_80551e9b-22ec-47d9-a375-29691372a34f.jpg?v=1702969299&width=533)
![GA4 EC Monthly Report Template[4008]](http://88studio.io/cdn/shop/files/4008_75c0c108-4e41-4fee-87ec-e7c823b6939d.png?v=1743466274&width=533)
![GA4 Standard Report Template[4004]](http://88studio.io/cdn/shop/files/4004_f67fd549-68fe-46c3-b8bc-57b0cad056ee.png?v=1740969729&width=533)
![GA4 EC Standard Report Template[4012]](http://88studio.io/cdn/shop/files/4012v2.0.png?v=1745371761&width=533)
![Google Ads Report Template[4003]](http://88studio.io/cdn/shop/files/4003_v2_1.png?v=1737458695&width=533)
![SEO Standard Report Template [4002]](http://88studio.io/cdn/shop/files/4002v2.0.png?v=1747814286&width=533)
![GA4 EC Basic Dashboard Template[4010]](http://88studio.io/cdn/shop/files/4010v2.0.png?v=1745966967&width=533)
![SEO Monthly Report Template[4011]](http://88studio.io/cdn/shop/files/4011_v2.png?v=1737028939&width=533)
![GA4 Dashboard Template[4009]](http://88studio.io/cdn/shop/files/4009v2.0.png?v=1740388404&width=533)