In Looker Studio, you can connect to Google Sheets data to create reports. Without the need to use BigQuery, you can process data directly in Google Sheets, which allows for quick updates and serves as a highly convenient data source for reporting. In this article, I will explain how to create Looker Studio reports using data from Google Sheets, including specific examples and key considerations to keep in mind.
What You Can Do by Connecting Google Sheets to Looker Studio
When the data you want to report does not have a dedicated connector in Looker Studio, or when creating data tables in BigQuery is difficult, using Google Sheets becomes a strong candidate.
If the raw data needs processing or if the data is updated frequently (with new entries or overwrites), you can directly edit it in Google Sheets. The edited data is reflected in Looker Studio reports almost in real-time.
One thing to note is that Google Sheets has a limit of 10 million cells. If your data exceeds this amount, you should consider using BigQuery, Google Cloud Storage, or other methods.
Here are some examples of using Google Sheets as a data source:
As you can see, it is used for a wide range of data. If you're regularly reviewing data in Google Sheets, try visualizing it clearly in Looker Studio.
How to Create a Data Source from Google Sheets
Now, let’s walk through the steps of creating a Google Sheets data source in Looker Studio. First, open Looker Studio and click on "Create" in the upper-left corner.

Next, click on the data source.

(Quote:Looker Studio)
Select Google Sheets from the list of available data source connections that can be used as a data source in Looker Studio.

(Quote:Looker Studio)
Search for and select the spreadsheet you created as the data source, then click connect.

(Quote:Looker Studio)
Options
Use first row as headers
It is enabled by default. If you want to use the first row as a header, leave the checkbox selected. If you want to edit the header yourself or if the data doesn't contain a header, uncheck the box before connecting.
Include hidden and filtered cells
This is also enabled by default. If you want to exclude filtered cells, please uncheck the box.
Include specific range
If the required data is only part of the specified sheet, you can narrow down the range here. Be cautious not to connect more data than necessary, as loading too much data into Looker Studio can affect performance, such as taking a longer time to reflect data in reports.
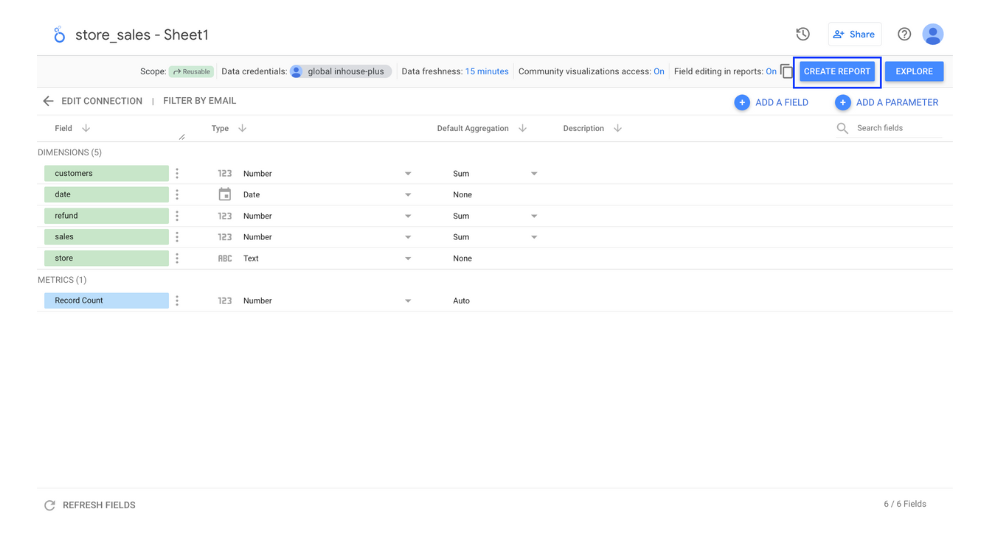
Once the connection is complete, a screen like the one below will appear. Data types such as dates and numbers will be automatically detected based on the content of the data. However, if the detected data types do not match your expectations, you can manually adjust them.

(Quote:Looker Studio)
User Settings for Displaying Data
You can configure which users can view the data from the created data source.
With Owner's Credentials, as long as the owner of the data source has access to the Google Sheets data, users viewing the report will be able to see the data.
With Viewer's Credentials, if users viewing the report do not have access to the Google Sheets, they will not be able to view the data in the report.
By default, Owner's Credentials is selected.

(Quote:Looker Studio)
Field editing in reports
You can toggle the field editing in the report between ON and OFF. When field editing is ON, you can make changes to the data types and other settings for data source fields directly from the report side. When it's OFF, data source editing is disabled from the report side. It is generally recommended to keep it ON as the default setting.

(Quote:Looker Studio)
How to Create a Report in Google Sheets
Now that the data source has been created, the next step is to create the report. Click 'Create Report' in the top-right corner of the data source.

(Quote:Looker Studio)
Then, the screen will switch to the report view, where you can select the type of graph you want to create from the "Insert" menu or by adding a graph.

(Quote:Looker Studio)
We were able to visualize the data from Google Sheets in the Looker Studio report this way.

(Quote:Looker Studio)
Points to Note
tabular format
The data in Google Sheets must be in the following tabular format.

(Quote:Google Sheets)
Header line must be one line
The header row must also be a single line.
Within columns are the same type
When you create a data source, each column is given a data type, such as date, numeric, text, etc. Data in Google Spreadsheets must be entered according to this data type. Entering text in a column with a numeric data type will result in an error and the data will not be displayed.
Access to files on shared drives is not supported.
Looker Studio's Google Spreadsheet Connector does not support access to files on shared drives, so you can only specify files on a regular Google Drive.

![[Looker StudioDetailed Explanation on How to Create Looker Studio Reports Using Data from Google Sheets]](http://88studio.io/cdn/shop/articles/1280_x_450_px_e93ca93d-2087-47d4-a6f5-47f24e27dee3.png?v=1728204894&width=1100)
![GA4 Summary Report Template[4013]](http://88studio.io/cdn/shop/files/4013thumbnail.png?v=1733209235&width=533)
![GA4 Monthly Report Template[4007]](http://88studio.io/cdn/shop/files/4007_GA4-monthly-report-firstview_80551e9b-22ec-47d9-a375-29691372a34f.jpg?v=1702969299&width=533)
![GA4 EC Monthly Report Template[4008]](http://88studio.io/cdn/shop/files/4008_75c0c108-4e41-4fee-87ec-e7c823b6939d.png?v=1743466274&width=533)
![GA4 Standard Report Template[4004]](http://88studio.io/cdn/shop/files/4004_f67fd549-68fe-46c3-b8bc-57b0cad056ee.png?v=1740969729&width=533)
![GA4 EC Standard Report Template[4012]](http://88studio.io/cdn/shop/files/4012v2.0.png?v=1745371761&width=533)
![Google Ads Report Template[4003]](http://88studio.io/cdn/shop/files/4003_v2_1.png?v=1737458695&width=533)
![SEO Standard Report Template [4002]](http://88studio.io/cdn/shop/files/4002v2.0.png?v=1747814286&width=533)
![GA4 EC Basic Dashboard Template[4010]](http://88studio.io/cdn/shop/files/4010v2.0.png?v=1745966967&width=533)
![SEO Monthly Report Template[4011]](http://88studio.io/cdn/shop/files/4011_v2.png?v=1737028939&width=533)
![GA4 Dashboard Template[4009]](http://88studio.io/cdn/shop/files/4009v2.0.png?v=1740388404&width=533)