The Complete Guide to Using Google Ads and Looker Studio (Formerly Data Studio) with Templates: How to Connect and Create Reports
This guide provides a clear and easy-to-follow approach to creating Google Ads reports using Looker Studio. It is designed to help you efficiently create fully automated Google Ads reports. The steps are outlined in a straightforward manner, making it accessible for beginners to start immediately. Reading this guide will enhance your skills in Google Ads report creation.
While Looker Studio is a powerful and free tool, mastering it requires some time. However, using templates simplifies the process, allowing you to focus on customizing pre-designed templates to fit your needs. This approach enables you to produce high-quality reports much faster than if you were to build them from scratch.
A wide range of free and premium templates are available online. If you're in search of top-notch quality, consider using 88studio's Looker Studio templates. These templates are trusted by over 2,000 companies and come with a buy-one-get-one-free offer. With a single purchase, you gain the flexibility to create reports for an unlimited number of sites, replicate reports in minutes, and tailor them to your preferences. Our team includes a leading web analyst as an advisor. We regularly update our templates to reflect changes in media specifications, like GA4, ensuring that you can use them confidently for years to come.
Popular Template: A Google Ad Report Template Popular for Reporting to Clients and Within Organizations
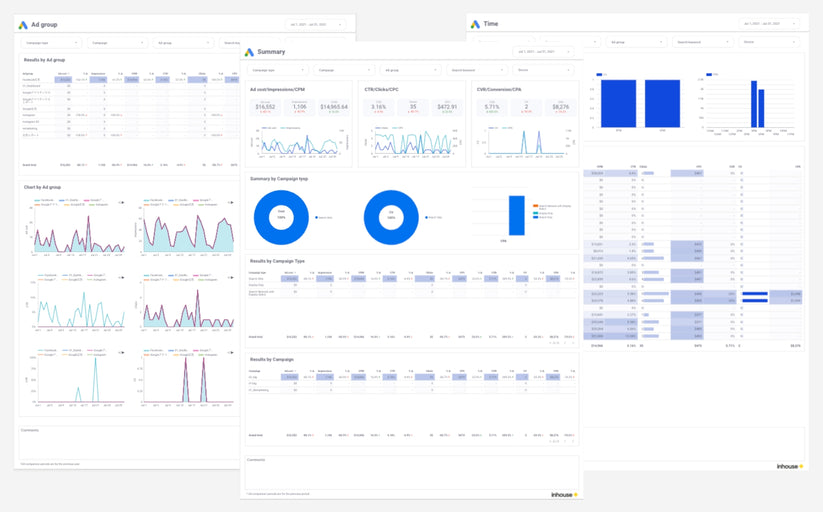
Quote: Google Ads report template[4003]
Demo Report
Report detail
What is Looker Studio(former data studio)?
Looker Studio is a free report creation tool offered by Google that connects with various data sources and allows for the creation of clear, fully automated reports. For instance, by using Looker Studio's official Google Ads connector, you can create very understandable Google Ads reports like the following.
Benefits of Creating Google Ads Reports with Looker Studio (Formerly Data Studio)
Free to Use
Looker Studio is free, making it widely used by organizations of all sizes, from small businesses to large corporations.
Enhanced Commission Settings and Comment Features for Agencies
Using calculated fields, you can display gross costs including both mark-up and mark-down commission rates, as well as fixed commissions. The ability to freely enter text also makes it easy to add comments.
Connect with Various Data through Over 800 Connectors
Looker Studio offers over 800 connectors, including Google-related media such as GA4, Google Analytics, Search Console, and Google Ads, as well as advertising data from Facebook Ads and Yahoo Ads, and social media data from Instagram and Twitter. This allows for connections with a wide variety of services.
You can also add data from GA, Search Console, and spreadsheets to your Google Ads reports.
Freely Customizable Design
A variety of charts (tables and graphs) are available, and the design (colors and fonts) can be set in great detail. This allows for the creation of reports that are easy to understand for anyone who views them.

Quote: Google Ads report template[4003]
Demo Report
Report detail
Abundant Templates
In the official template gallery, you can use templates created by Google. Using these templates, you only need to customize the necessary parts based on the pre-made templates, which allows you to create high-quality reports in significantly less time than starting from scratch.
Automatic Updates Once Reports are Created
Once you create a report in Looker Studio, it automatically updates the data every day, eliminating the need to create a large number of reports at the beginning of each month.
Furthermore, the reports offer interactive features, such as allowing viewers to change the display period or use filters for specific data, which means report administrators no longer need to constantly handle detailed revision requests from viewers.
Shareable in Various Ways, Including Automatic Emailing and PDF Downloads Like a spreadsheet
Looker Studio allows anyone to access the latest data by sharing a URL, regardless of whether they have permission to access the Google Ads account. It’s also possible to automatically send performance data from the previous day to stakeholders via email every morning or to download reports as PDFs for use in presentations.
Understanding the Integration of Looker Studio (Formerly Known as Data Studio) and Google Ads
Using Looker Studio is incredibly easy. After integrating Looker Studio with Google Ads to create a data source, you simply use that data source to create a report, and once the report is finished, all that's left is to share it. For those using it for the first time, the guide 'The Ultimate Save Edition: How to Use Looker Studio (Formerly Data Portal) | Easily Explained Features and Benefits' includes instructions for getting started, so please follow those steps after setting it up.
Now, let me introduce you to the method of integration. Let's try it out following these steps.
Step 1
Open Looker Studio and select 'Data Source' from 'Create' on the home screen.

Step 2
From the list of connectors screen, select "Google Ads".

Step 3
Next, select the target Google Ads account.
Once you grant Looker Studio access to your Google Ads account, the available Google Ads accounts and reports will be displayed. As shown in the figure below, select the desired option and click 'Connect' at the top right.

Check the Google Account You're Logged Into If the Target Google Ads Account Does Not Appear
This screen displays Google Ads accounts associated with the currently logged-in Google Account. If the Google Ads account you wish to use for reporting does not appear here, please check if the logged-in Google Account has the necessary permissions for the target Google Ads account.
Step 4
After connecting, once you move to the field list screen as shown in the figure below, the creation of your data source is complete. After changing the name in the top left corner for easy recognition later, select 'Create Report' in the top right corner and proceed to report creation.

How to Create Google Ads Reports Using Looker Studio (Formerly Data Studio)
Once the report creation interface is displayed, let's start making a report. The creation of a report mainly consists of the following four steps:
- Select the type of graph
- Set dimensions and metrics
- Set the style
- Add controls
Selecting the Type of Graph
Looker Studio offers 11 types of graphs. Choose the most suitable type of graph according to the purpose of your report.
- Table: Allows for detailed display of numbers
- Scorecard: Displays the total value of key metrics
- Time Series: Shows trends over time
- Bar: Compares the magnitude of numerical values by item
- Pie: Displays the percentage of each item
- Google Maps: Displays geographic data on a map
- Map Chart: Displays regional data on a map
- Line: Shows trends over time
- Area: Displays trends over time along with their breakdown
- Scatter: Represents the correlation between two metrics
- Pivot Table: Allows for cross-tabulation using two dimensions


In this article, we will create a daily report using the graph type "Table" as an example, so go to "Add Graph" and add "Table".

Select dimensions and metrics
Here's a helpful guide to assist you in the process.
- Dimension: Day
- Metric: Cost, Clicks, Impressions, Conversions, CTR, Avg. CPM, Avg.CPC

Change the metrics Name
If the name is unclear, change it to something more understandable.
Step 1
Click the pencil icon next to the item you want to change.

Step 2
If a new metric name is entered, it will be overwritten.

Change the style
After setting up dimensions and metrics, set up styles to make them easier to see.
Adjusting Column Width
Right-click while the table is selected, and choose 'Distribute evenly' from the 'Resize Columns' option.

Sort by Date
Select 'Date' in the sorting options and set it to 'Ascending Order'.

Changing the Graph Format
Switch the tab from 'Settings' to 'Style', change the metric you want to highlight (in this case, Conversions) to 'Bar Chart', and check the 'Display Numbers' option.

Adding Controls
To finish up, we'll add controls.
Adding controls allows users with whom the report is shared to select time periods and use filters to narrow down the data.
Adding a Date Range
Step 1
Select 'date range controll' from the 'Insert' menu.

Step 2
Select the "Auto date range" for the default date range.

Step 3
You will see options like 'This Week (from Monday)', 'This Month', 'From the Beginning of This Month to Today', and 'Last Month'. Choose the one that best suits your needs. Note that daily reports are often used to track the progress of the current month or to summarize the results of the previous month. Therefore, I recommend selecting 'From the Beginning of This Month to date' or 'Last Month'.

How to Share Looker Studio (Formerly Data Studio) Reports
Add users (grant access to individual users)
After selecting 'Share' in the top right corner, enter the target email address (associated with a Google account) similarly to how you manage permissions in Google Sheets. Choose either 'Viewer' or 'Editor' and then click 'Send'.

Adding Users (Granting Access to Multiple Users at Once)
Switch to the 'Manage Access' tab, select options like 'Anyone with the link can view' or 'Anyone with the link can edit', and then share the report URL via email.
Download as PDF
After selecting 'Share' in the top right corner, choose 'Download Report', then select the pages you want to download and click 'Download'.

Key Google Ads Dimensions and Metrics Available in Looker Studio (Formerly Data Portal)
Please note that the report covers the following items. Please refer to the actual Google ad data source to view available dimensions and metrics.
Cost
Cost refers to the advertising expenses incurred, and it is recommended to clarify whether the management fee charged by an advertising agency is included in this cost beforehand.
Impressions
Cost per impression (CPM)
It refers to the average cost of displaying a single ad to a user 1,000 times. To calculate the CPM, the cost of the ad is divided by the number of times it is displayed and then multiplied by 1,000. For instance, if an ad is displayed 10,000 times and costs 50,000 yen, the CPM would be 5,000 yen.
Click Through Rate (CTR)
It refers to the percentage of users who clicked on an ad after it was displayed. CTR is calculated by dividing the number of clicks by the number of times the ad was shown. If an ad were displayed 1,000 times and received 5 clicks, the CTR would be 0.5%.
Clicks
They refer to the number of times a user clicks an ad. If the same user clicks on an ad multiple times, each click is counted separately. However, only a maximum of two clicks per user on a single ad is counted towards billing. Additionally, any clicks flagged invalid by Google's system will not be counted.
CPC (Cost Per Click)
The CPC, or Cost Per Click, refers to the average cost of acquiring a single click. To calculate CPC, divide the total cost by the number of clicks. For instance, if you spent 50,000 yen and received 100 clicks, your CPC would be 500 yen.
CVR (Conversion Rate)
Conversion Rate (CVR) refers to the proportion of users who click on an advertisement and convert. To calculate CVR, divide the number of clicks by the number of conversions. For instance, if there were 100 clicks and 2 conversions, the CVR would be 2%.
Conversion
It refers to the number of user actions considered conversions on the ad management screen after a user clicks (or views) an ad. If you have an e-commerce website, setting a conversion value enables you to track both the number of conversions and sales.
CPA (Cost Per Conversion)
It is the average cost of acquiring one conversion. To calculate it, you divide the total cost by the number of modifications. For instance, if there are 5 conversions and the price is 50,000 yen, the CPA would be 50,000 yen.
ROAS
ROAS is a metric that indicates the sales generated compared to the advertising cost. It is calculated by dividing the conversion value by the price of a conversion value set for the e-commerce site. To illustrate, if the conversion value is 5 million yen and the cost is 1 million yen, the ROAS is 500%.
Google Ads Looker Studio Report Template
The templates I'm about to introduce are all created using Looker Studio and the free Google Ads connector, except for the Creative Report and Placement Report.
Those proficient in using Looker Studio can refer to the demo reports and create their own, or consider purchasing our templates to save time instead of starting from scratch. You are welcome to customize the purchased templates as you wish.
Summary Report
In addition to KPI summaries, you can view results by type of campaign (search, display, video, etc.) and by campaign.

Learn more about Google Ads report template.
Monthly Report
This is a monthly report where you can check the progress of each KPI from month to month. Although operational advertising tends to be short-sighted, the monthly report allows you to always have a bird's eye view of the current situation.By checking the numerical values detailed in the table, you can capture the global trend in the graph.
Learn more about Google Ads report template.
Daily Report
This is a daily report where you can check the daily progress of each KPI. You can check in detail how each KPI changed prior and after each measure. As with the Monthly Report, you can check detailed numerical values in a table while grasping overall trends in a chart.
Learn more about Google Ads report template.
Campaign Report
This is a campaign report that allows you to check the performance of each campaign,Since the highest tier in Google Ads is the campaign, you can first analyze the effectiveness of each campaign from a bird's eye view, and then dig deeper into the ad groups and keywords introduced next.
Learn more about Google Ads report template.
Ad Group Report
An ad group report that allows you to verify the performance of each ad group.
Learn more about Google Ads report template.
Keyword Report
A keyword report that allows you to check the performance of every keyword you bid.
Learn more about Google Ads report template.
Query Report
This search phrase report allows you to see performance by the search terms that users actually search for. Especially if you are using partial match (Broad) or phrase match (Phrase) match types, check to see if you are wasting money on less relevant search terms. If it does, exclude these search terms.
Learn more about Google Ads report template.
Final page URL Report
Final page URL report to check performance per final page URL (landing page).
Learn more about Google Ads report template.
User Report
User reports allows you to verify performance by age, gender, and other user attributes.
Learn more about Google Ads report template.
Device Report
Device report to check performance of the device.
Learn more about Google Ads report template.
Region Report
Regional reports allow you to see performance per region.
Learn more about Google Ads report template.
Time Report
Time of day report to check performance based on time of day.
Learn more about Google Ads report template.
FAQ
How do you show your expenses, including management fees?
Using a feature called Calculated Fields in Looker Studio (formerly Data Studio), you can set the cost of advertising, including commissions. Open your target data source and select "Add Field" to start.
a. Open the target data source and select "Add Field.”

b. Set each field as follows
- Field name: Ad cost
- Calculation formula (example): Cost*1.2 (to add 20% commission to the advertising cost)

To set up conversions:
You need to choose between "Conversions" and "All Conversions."
The "Conversions" option can be selected from any indicator in the pull-down menu.
- Conversions (included in the Conversions column of the Ad Management screen)
- All Conversions (included in the All Conversions column of the Ad Management screen)

Learn how to set up specific conversions.
To set up individual conversion actions in Looker Studio (formerly Data Studio), the free Google Ads Connector does not provide the option to choose specific conversion indicators. You may request an engineer to retrieve the necessary data through the Google Ads API as a solution.
88studio report template to automate Google ad reports
88studio provides Google Ad reports for a variety of needs.
Google Ads report template
Simple Google ad report template with commission settings and commentary features for ad agencies.

Quote: Google Ads report template[4003]
Demo Report
Report detail
Over 2,000 companies use Looker Studio (former Data Portal) templates from 88studio
88studio offers a wide variety of customizable Looker Studio report templates to meet a variety of needs. If you want to automate report creation but find it difficult to create your own reports from scratch, use 88studio to make the most of your time.
Compatible with GA4, Search Console, and Google Ads. With a single purchase, you can create reports for an unlimited number of sites, copy reports in minutes, and customize them as you wish. Google Analytics expert Taku Ogawa is on board as an advisor to ensure that the templates are updated whenever there is a change in the GA4 specifications, so you can use it with peace of mind for years to come.
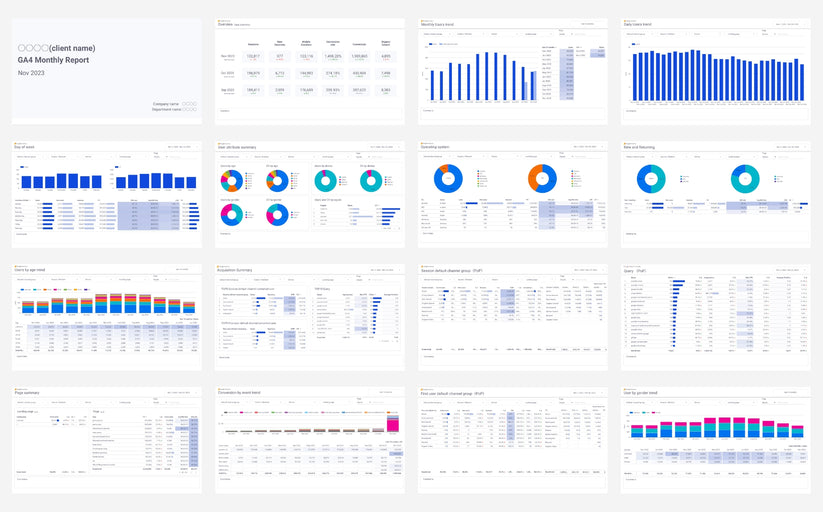
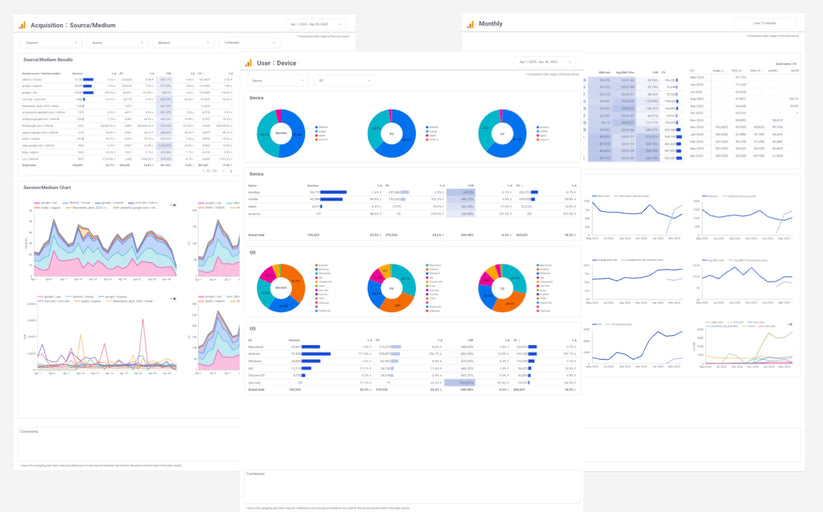
GA4 Monthly Report Template[4007]
This is a 61-page Looker Studio GA4 monthly report template that allows you to automate GA4 monthly reporting reports.
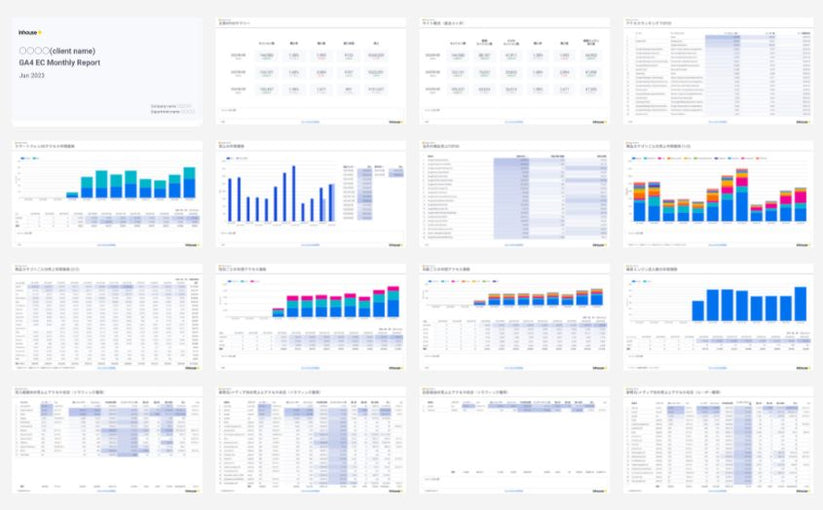
GA4 EC Monthly Report Template[4008]
This is a 61-page Looker Studio GA4 monthly report template that allows you to automate GA4 monthly reporting reports.
GA4 Standard Report Template[4004]
This is a versatile 18-page GA4 report template that allows anyone to easily automate reporting and streamline daily monitoring.
GA4 EC Standard Report Template[4012]
This is a 22-page universal GA4 report template for e-commerce sites that allows anyone to easily automate reporting for e-commerce sites and streamline daily monitoring.



![GA4 Summary Report Template[4013]](http://88studio.io/cdn/shop/files/4013thumbnail.png?v=1733209235&width=533)
![GA4 Monthly Report Template[4007]](http://88studio.io/cdn/shop/files/4007_GA4-monthly-report-firstview_80551e9b-22ec-47d9-a375-29691372a34f.jpg?v=1702969299&width=533)
![GA4 EC Monthly Report Template[4008]](http://88studio.io/cdn/shop/files/4008_75c0c108-4e41-4fee-87ec-e7c823b6939d.png?v=1743466274&width=533)
![GA4 Standard Report Template[4004]](http://88studio.io/cdn/shop/files/4004_f67fd549-68fe-46c3-b8bc-57b0cad056ee.png?v=1740969729&width=533)
![GA4 EC Standard Report Template[4012]](http://88studio.io/cdn/shop/files/4012v2.0.png?v=1745371761&width=533)
![Google Ads Report Template[4003]](http://88studio.io/cdn/shop/files/4003_v2_1.png?v=1737458695&width=533)
![SEO Standard Report Template [4002]](http://88studio.io/cdn/shop/files/4002v2.0.png?v=1747814286&width=533)
![GA4 EC Basic Dashboard Template[4010]](http://88studio.io/cdn/shop/files/4010v2.0.png?v=1745966967&width=533)
![SEO Monthly Report Template[4011]](http://88studio.io/cdn/shop/files/4011_v2.png?v=1737028939&width=533)
![GA4 Dashboard Template[4009]](http://88studio.io/cdn/shop/files/4009v2.0.png?v=1740388404&width=533)