Learn How to Create Looker Studio( Formerly Data Studio) x Search Console Report with Template | Methods for Integration and Report Creation
This guide clearly explains how to create SEO reports using Search Console with Looker Studio. By reading this guide, you will be able to efficiently create fully automated Search Console reports. The steps are explained in detail, making the content easy to practice even for beginners. Read this article and improve your skills in creating Search Console reports.
While Looker Studio is a free and highly functional tool, it may take some time to master. However, by using templates, you can create high-quality reports in much less time than if you were to create a report from scratch, as you only need to customize the necessary parts based on a pre-made template.
There are various templates available online, ranging from free to paid. For those looking for high-quality templates, consider using Looker Studio templates from 88studio, which are used by over 2,000 companies. Their one-time purchase plan allows unlimited site reporting. The reports can be completed in just a few minutes by simply copying them, and customization is entirely flexible. Furthermore, as a leading web analyst is involved as an advisor, the templates are updated timely in response to changes in specifications from media sides such as GA4, ensuring continued peace of mind for users.
Popular Template: A SEO Template Popular for Reporting to Clients and Within Organizations
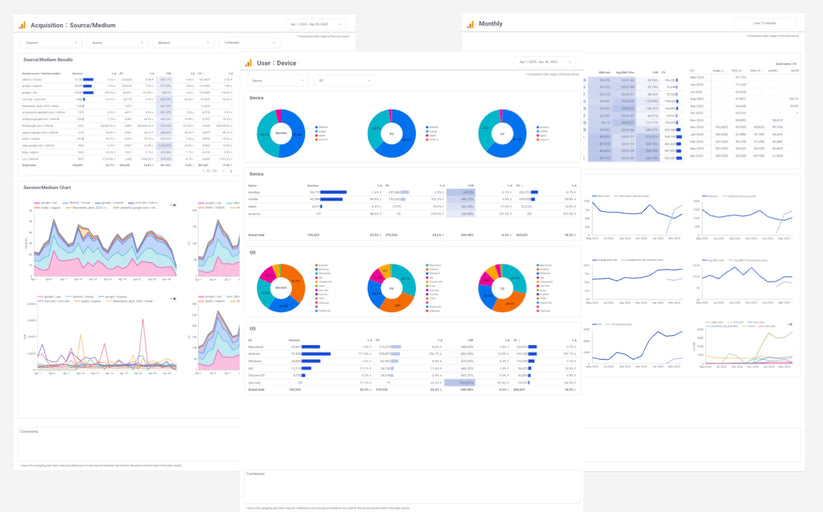
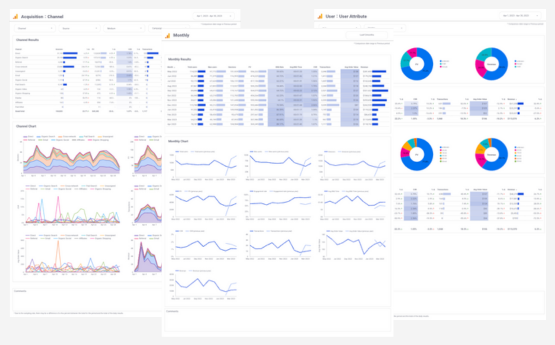
Quote: SEO monthly report template[4011]
Demo Report
Report detail
What is Looker Studio (formerly Data Portal)?
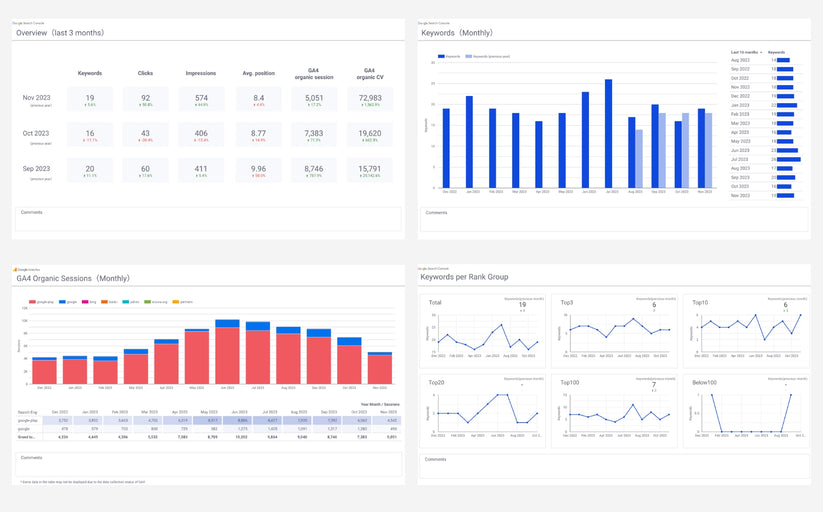
Looker Studio is a free reporting tool provided by Google that connects to various data sources and allows for the creation of easy-to-understand, fully automated reports. For example, by using the official Search Console connector of Looker Studio, it is possible to create very clear Search Console reports like the following.

Quote: SEO monthly report template[4011]
Demo Report
Report detail
Benefits of Creating Search Console Reports with Looker Studio (Formerly Data Studio)
Available for Free
Looker Studio is available for free, making it widely used by organizations of all sizes, from small businesses to large corporations.
All Search Queries Can Be Viewed (Up to the Top 1,000 in the Search Console Management Screen)
It's very important to know what keywords users are searching for when they visit your website. However, with the Google Search Console management screen, you cannot see all the keywords. In reality, only the top 1,000 search queries are displayed. However, by using the Search Console connector in Looker Studio, you can view all search queries without this limitation.
For reference, on the site we manage, we were able to view up to 100,000 search queries using Looker Studio. This is about 100 times the amount that can be confirmed in the Search Console.

The number of search queries can be checked
I believe many people set the number of search queries as a KPI for SEO, but this number of search queries cannot be directly confirmed on the Search Console management screen. However, by using Looker Studio, it is possible to check the number of search queries (referred to as 'Number of Keywords' on reports) by utilizing the feature called 'calculated fields'.

Quote: SEO monthly report template[4011]
Demo Report
Report detail
Connect with Various Data through Over 800 Connectors
Looker Studio offers over 800 connectors, including Google-related media such as GA4, Google Analytics, Search Console, and Google Ads, as well as advertising data from Facebook Ads and Yahoo Ads, and social media data from Instagram and Twitter. This allows for connections with a wide variety of services.
You can also add data from GA, Search Console, and spreadsheets to your Google Ads reports.

Freely Customizable Design
A variety of charts (tables and graphs) are available, and the design (colors and fonts) can be set in great detail. This allows for the creation of reports that are easy to understand for anyone who views them.

Quote: SEO monthly report template[4011]
Demo Report
Report detail
Abundant Templates
In the official template gallery, you can use templates created by Google. Using these templates, you only need to customize the necessary parts based on the pre-made templates, which allows you to create high-quality reports in significantly less time than starting from scratch.
Automatic Updates Once Reports are Created
Once you create a report in Looker Studio, it automatically updates the data every day, eliminating the need to create a large number of reports at the beginning of each month.
Furthermore, the reports offer interactive features, such as allowing viewers to change the display period or use filters for specific data, which means report administrators no longer need to constantly handle detailed revision requests from viewers.
Shareable in Various Ways, Including Automatic Emailing and PDF Downloads Like a spreadsheet
Looker Studio allows anyone to access the latest data by sharing a URL, regardless of whether they have permission to access the Google Ads account. It’s also possible to automatically send performance data from the previous day to stakeholders via email every morning or to download reports as PDFs for use in presentations.
Understanding the Integration of Looker Studio (Formerly Known as Data Studio) and Google Search Console
Using Looker Studio is incredibly easy. After integrating Looker Studio with Google Search Console to create a data source, you simply use that data source to create a report, and once the report is finished, all that's left is to share it. For those using it for the first time, the guide 'The Ultimate Save Edition: How to Use Looker Studio (Formerly Data Portal) | Easily Explained Features and Benefits' includes instructions for getting started, so please follow those steps after setting it up.
Now, let me introduce you to the method of integration. Let's try it out following these steps.
Step 1
Open Looker Studio and select 'Data Source' from 'Create' on the home screen.

Step 2
From the list of connectors screen, select "Search Console".

Step 3
After providing access to the Google Search Console, you can view the various sites, tables, and search types that are available for selection within Looker Studio.
- Tables: site impressions
- Search type: web

Check the Google Account You're Logged Into If the Target Google Ads Account Does Not Appear
This screen displays Google Ads accounts associated with the currently logged-in Google Account. If the Google Ads account you wish to use for reporting does not appear here, please check if the logged-in Google Account has the necessary permissions for the target Google Ads account.
Step 4
After connecting, you will be directed to the list of fields screen, which signifies that your data source creation is finished. Look for "Create Report" in the upper right corner to start creating your report.
How to Create Search Console Reports Using Looker Studio (Formerly Data Studio)
Once the report creation interface is displayed, let's start making a report. The creation of a report mainly consists of the following four steps:
- Select the type of graph
- Set dimensions and metrics
- Set the style
- Add controls
Selecting the Type of Graph
Looker Studio offers 11 types of graphs. Choose the most suitable type of graph according to the purpose of your report.
- Table: Allows for detailed display of numbers
- Scorecard: Displays the total value of key metrics
- Time Series: Shows trends over time
- Bar: Compares the magnitude of numerical values by item
- Pie: Displays the percentage of each item
- Google Maps: Displays geographic data on a map
- Map Chart: Displays regional data on a map
- Line: Shows trends over time
- Area: Displays trends over time along with their breakdown
- Scatter: Represents the correlation between two metrics
- Pivot Table: Allows for cross-tabulation using two dimensions


In this article, we will create a daily report using the graph type "Table" as an example, so go to "Add Graph" and add "Table".

Select dimensions and metrics
Here's a helpful guide to assist you in the process.
- Dimension: Date
- Metric: Impressions, Clicks, Site CTR, Average Position

Change the metrics Name
If the name is unclear, change it to something more understandable.
Step 1
Click the pencil icon next to the item you want to change.

Step 2
If a new metric name is entered, it will be overwritten.

Change the style
After setting up dimensions and metrics, set up styles to make them easier to see.
Adjusting Column Width
Right-click while the table is selected, and choose 'Distribute evenly' from the 'Resize Columns' option.

Sort by Clicks
Select 'Clicks' in the sorting options and set it to 'Descending Order'.

Changing the Graph Format
Switch the tab from 'Settings' to 'Style', change the metric you want to highlight (in this case, Clicks) to 'Bar Chart', and check the 'Display Numbers' option.

Adding Controls
To finish up, we'll add controls.
Adding controls allows users with whom the report is shared to select time periods and use filters to narrow down the data.
Adding a Date Range
Step 1
Select 'date range controll' from the 'Insert' menu.

Step 2
Select the "Auto date range" for the default date range.

Step 3
You will see options like 'This Week (from Monday)', 'This Month', 'From the Beginning of This Month to Today', and 'Last Month'. Choose the one that best suits your needs. Note that daily reports are often used to track the progress of the current month or to summarize the results of the previous month. Therefore, I recommend selecting 'From the Beginning of This Month to date' or 'Last Month'.

How to Share Looker Studio (Formerly Data Studio) Reports
Add users (grant access to individual users)
After selecting 'Share' in the top right corner, enter the target email address (associated with a Google account) similarly to how you manage permissions in Google Sheets. Choose either 'Viewer' or 'Editor' and then click 'Send'.

Adding Users (Granting Access to Multiple Users at Once)
Switch to the 'Manage Access' tab, select options like 'Anyone with the link can view' or 'Anyone with the link can edit', and then share the report URL via email.

Download as PDF
After selecting 'Share' in the top right corner, choose 'Download Report', then select the pages you want to download and click 'Download'.

Key Dimensions and Metrics Available in Looker Studio (formerly Data Portal) for the Search Console
The following key items are available. Please check the actual Search Console data sources for all available dimensions and metrics (Site data source, URL data source).
Keywords
This is the unique number of keywords for which links to your site appeared in users' search results. It can be set using calculated fields based on data from Google Search Console.
Clicks
This is the 'Number of Clicks' from Google Search Console. It is the unique number of keywords for which links to your site appeared in users' search results.
Impression:s
This is the 'Number of Impressions' from Google Search Console. It is the number of times links to your site appeared in users' search results.
Average CTR
This is the 'Average CTR' from Google Search Console. It is the ratio of how many times links displayed actually led to clicks.
Average Position
This is the 'Average Position' from Google Search Console. It is the average position of your site when it appeared in search results.
Sessions
This is 'Sessions' from GA4. It is the number of visits to the website. For example, if a user visits a website twice, the session count is 2.
Conversions
This is 'Conversions' from GA4. It is the total of conversion events set in GA4.
Keyword
This is 'Queries' from Google Search Console. It is the keywords that users searched for.
Pages
This is 'Pages' from Google Search Console. It is the pages that appeared in search results.
Search Console Looker Studio Report Template
The templates I'm about to introduce are all created using Looker Studio and the free Search Console connector, except for the Creative Report and Placement Report.
Those proficient in using Looker Studio can refer to the demo reports and create their own, or consider purchasing our templates to save time instead of starting from scratch. You are welcome to customize the purchased templates as you wish.
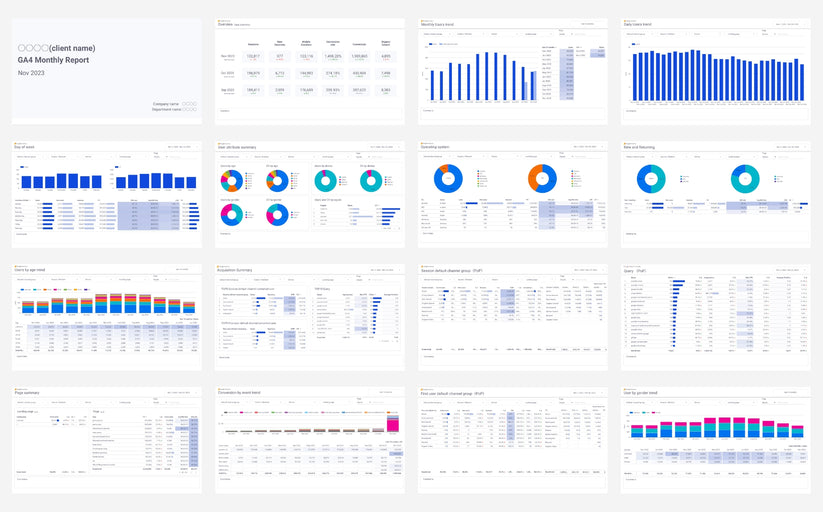
Cover Page
On the cover page, you will include the client's name, the target month of the report, your own logo, your company name, and the department you belong to. This template, including the logo, is fully editable, so please feel free to arrange and use it as you wish.

Quote: SEO monthly report template[4011]
Summary of Results via SEO
Sessions and conversions via Organic Search in GA4
The first page is the most important for verifying the return on investment for SEO, showing sessions and conversions via GA4. This template includes a comment section at the bottom of every page except the cover, so let's also include how to interpret these data as a summary.

Quote: SEO monthly report template[4011]
Verifying return on investment is essential using GA4 data instead of Search Console. This is because GA4 data is more reliable for the following reasons.
- Search console only includes Google Search and GA4 includes search engines other than Google Search.
- Search Console measures even if the user closes the browser before clicking to open the page, while GA4 does not.
Google Search Console display count, number of clicks, and average listing position
Let's take a closer look at the KPIs for SEO next.

Quote: SEO monthly report template[4011]
SEO KPIs should cover the following items
- Keywords: This is the number of unique keywords for which a link to the site appears in a user's search results; it can be set in a calculation field based on Google Search Console data.
- Clicks: This is the "number of clicks" in Google Search Console. It is the unique number of keywords for which a link to your site appears in the user's search results.
- Impressions: This is the "number of times displayed" in the Google Search Console. This is the number of times a link to your site appears in a user's search results.
- Avg.Position: This is the "Average Publication Ranking" of the Google Search Console. It is the average ranking of the site when the site appears in the search results.
Monthly and daily trends for each KPI
Check how each KPI has performed on a monthly and daily basis.

Quote: SEO monthly report template[4011]

Quote: SEO monthly report template[4011]
The sample provided several keywords, but it is crucial to address the following KPIs at a minimum.
- keywords
- clicks
- Impressions
- Average CTR
- Average listing position
- Sessions via organic search in GA4
- Conversions via organic search in GA4
Trends in ranking for target keywords
To achieve top rankings, check the average ranking of your target keywords.

Quote: SEO monthly report template[4011]
An issue often encountered in SEO is when clicks increase but do not result in conversions. To address this, it's crucial to prioritize keywords expected to lead to conversions and track their progress in rankings.
To optimize search engine results, it's best to establish target keywords in the following manner.
- Check the landing page with the most conversions via organic search in GA4.
- Check the search queries for the above pages in the search console.
- Set the top XX positions of the above search queries as target keywords.
Keywords by ranking group
For a broader understanding of SEO rankings, consider examining the number of keywords per ranking group, such as those in the top 3 positions. This is especially helpful when dealing with a vast amount of target keywords.

Quote: SEO monthly report template[4011]
Keywords that experienced significant fluctuations compared to the previous month.
Find keywords that have significantly increased or decreased clicks on a month-over-month basis.

Quote: SEO monthly report template[4011]
List of all keywords and pages
Check the list to review all the keywords and pages that helped with SEO. However, only the top 1,000 positions are displayed on the Search Console management screen. Use Looker Studio (previously known as Google Data Studio) to generate reports without any keyword limit.

Quote: SEO monthly report template[4011]
Frequently Asked Questions
The Difference Between Site Impressions and URL Impressions
The former is aggregated at the site level, while the latter is aggregated at the page level, resulting in a difference in the method of aggregation. For example, if a search for a certain keyword displays three of your company's pages from 1st to 3rd place, and two of those pages are clicked, the results would be as follows.
| Impressions | Clicks | Avg.Position | |
| Site Impressions | 1 | 1 | 1 |
| URL Impressions | 3 | 2 | - |
I think the following basic rules are good because if the rules for distinguishing are ambiguous, the credibility of the data decreases.
Basically, use 'site impressions.' Only use 'URL impressions' when you want to analyze a page.
Dimensions and Metrics for 'Site Impressions' and 'URL Impressions
Note that 'Site Impressions' do not have a Landing Page dimension, whereas 'URL Impressions' do not have an Average Position metric.
Dimensions of 'Site Impressions'
- Date
- Device Category
- Country
- Google Property (type of search)
- Query
Metrics for 'Site Impressions'
- Clicks
- Impressions
- SiteCTR (Average CTR)
- Average Position (only for Site Impressions)
Dimensions of 'URL Impressions'
- Date
- Device Category
- Country
- Google Property (type of search)
- Query
- Landing Page (only for URL Impressions)
Metrics for 'URL Impressions'
- Clicks
- Impressions
- URL CTR (Average CTR)
What is a Search Type?
A search type refers to the kind of search targets that appear in Google's search results. There are various types, but it is basic to choose the web

Search Types for 'Site Impressions' and 'URL Impressions
Search Types for 'Site Impressions'
- Web
- Images
- Videos
- Latest Music
Search Types for 'URL Impressions'
- Web
- Images
- Videos
- Latest Music
- Recommended
- Google News"
How to review all search queries.
Please try the following method for exporting from Looker Studio to Google Sheets, as it is convenient.
Step1:
Select the ︙ (vertical 3-point leader) in the upper right corner of the figure and select export

Step 2:
Select "Google Spreadsheet" as the format, check the box for "Fit to Value Format", and select "Export".

Once you complete the task, the data will be automatically exported to a Google Spreadsheet. That's all you need to do.

(Related article)
[Looker Studio] How to export data from a graph to a Google Spreadsheet or CSV (Excel)
How to Display the Number of Search Queries Using a Calculated Field
By creating a calculated field using the COUNT_DISTINCT function, which counts the number of unique values, it becomes possible to display the number of search queries (number of keywords).
COUNT_DISTINCT(Query)

Over 2,000 companies use Looker Studio (former Data Portal) templates from 88studio
88studio offers a wide variety of customizable Looker Studio report templates to meet a variety of needs. If you want to automate report creation but find it difficult to create your own reports from scratch, use 88studio to make the most of your time.
Compatible with GA4, Search Console, and Google Ads. With a single purchase, you can create reports for an unlimited number of sites, copy reports in minutes, and customize them as you wish. Google Analytics expert Taku Ogawa is on board as an advisor to ensure that the templates are updated whenever there is a change in the GA4 specifications, so you can use it with peace of mind for years to come.
GA4 Monthly Report Template[4007]
This is a 61-page Looker Studio GA4 monthly report template that allows you to automate GA4 monthly reporting reports.
GA4 EC Monthly Report Template[4008]
This is a 61-page Looker Studio GA4 monthly report template that allows you to automate GA4 monthly reporting reports.
GA4 Standard Report Template[4004]
This is a versatile 18-page GA4 report template that allows anyone to easily automate reporting and streamline daily monitoring.
GA4 EC Standard Report Template[4012]
This is a 22-page universal GA4 report template for e-commerce sites that allows anyone to easily automate reporting for e-commerce sites and streamline daily monitoring.
![GA4 Summary Report Template[4013]](http://88studio.io/cdn/shop/files/4013thumbnail.png?v=1733209235&width=533)
![GA4 Monthly Report Template[4007]](http://88studio.io/cdn/shop/files/4007_GA4-monthly-report-firstview_80551e9b-22ec-47d9-a375-29691372a34f.jpg?v=1702969299&width=533)
![GA4 EC Monthly Report Template[4008]](http://88studio.io/cdn/shop/files/4008_75c0c108-4e41-4fee-87ec-e7c823b6939d.png?v=1743466274&width=533)
![GA4 Standard Report Template[4004]](http://88studio.io/cdn/shop/files/4004_f67fd549-68fe-46c3-b8bc-57b0cad056ee.png?v=1740969729&width=533)
![GA4 EC Standard Report Template[4012]](http://88studio.io/cdn/shop/files/4012v2.0.png?v=1745371761&width=533)
![Google Ads Report Template[4003]](http://88studio.io/cdn/shop/files/4003_v2_1.png?v=1737458695&width=533)
![SEO Standard Report Template [4002]](http://88studio.io/cdn/shop/files/4002v2.0.png?v=1747814286&width=533)
![GA4 EC Basic Dashboard Template[4010]](http://88studio.io/cdn/shop/files/4010v2.0.png?v=1745966967&width=533)
![SEO Monthly Report Template[4011]](http://88studio.io/cdn/shop/files/4011_v2.png?v=1737028939&width=533)
![GA4 Dashboard Template[4009]](http://88studio.io/cdn/shop/files/4009v2.0.png?v=1740388404&width=533)