The drill-down feature in Looker Studio allows you to dynamically switch between different dimensions in a hierarchy. By using this feature, you can represent multiple layers within a single graph, helping reduce the overall number of graphs in your report. In this article, we’ll explain in detail how to use the drill-down feature with GA4 data as an example.
What is Drill-Down in Looker Studio?
The drill-down feature allows you to dynamically switch the dimension displayed in a single graph. For example, you can change a graph that shows sales by product category to display sales by individual products. This way, you can represent both category-level and product-level sales within a single graph rather than creating separate ones, helping streamline the report with fewer graphs overall. It’s recommended to set up drill-downs with hierarchies such as year > month > day.

(Quote:Looker Studio)
Table Drill-Down (Drill Action)
When a graph is in table format, it can be used differently. When you hover over an item in the table, a screen like the one below appears, allowing you to filter by that item, adjust the hierarchy, or navigate to more detailed content.

(Quote:Looker Studio)
How to Set Up Drill-down
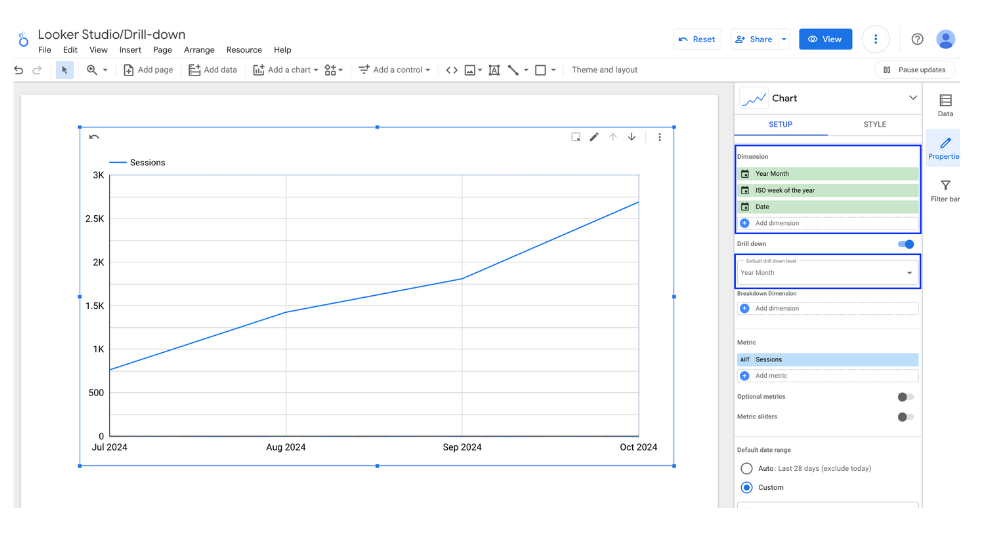
This section will explain the specific steps for setting up drill-downs. First, select the chart where you want to enable drill-down in edit mode and turn on the drill-down feature. Next, add the dimensions you wish to include in the drill-down. Arrange the dimensions from top to bottom in order of increasing detail. You can change the order by dragging the dimensions. Finally, choose the default drill-down level. It’s recommended to set the most commonly used dimension as the default drill-down level.

Next, we will configure the drill-down display settings for the report. Select this option from the graph's header menu in the Style tab. When setting up drill-down, you can choose between "Always Show" or "Show on Hover." The default setting is "Show on Hover," but as of October 30, 2024, there are cases where this may not display correctly. Therefore, we recommend selecting "Always Show" if you have configured drill-down.

(Quote:Looker Studio)
How to Set Up Table Drill-Down (Drill Action)
When the graph is in table format, an additional drill-down setting can be configured beyond the previous setup. First, turn on drill-down and click the icon to the left of the dimension you want to configure.

(Quote:Looker Studio)
Click on "Add Drill Action" that appears.

(Quote:Looker Studio)
As before, add the dimensions in the hierarchy you want to set for drill-down. Additionally, for drill-through, you can add a relevant content URL related to the data. Set up links to another page within the same report or to internal content related to that data.

(Quote:Looker Studio)
That completes the setup.
Example of GA4 Data Drill-Down Settings
Here, we introduce some examples of drill-down settings for GA4 data. The key point for drill-down is to set up in a hierarchical order, so be mindful of this when configuring it.
- Default Channel Group of Sessions > Session Source/Medium > Session Campaign
- Year > Year and Month > ISO Year and ISO Week > Date
- Item Category > Item Name
- Country > Region > City
Configure the hierarchy from larger to smaller elements, as shown in these examples.
How to Use Drill-Down When Viewing Reports
Here’s an explanation of how to use the drill-down feature in the configured graph. An arrow icon appears in the upper right corner of graphs with drill-down settings. Click this icon to drill up or drill down through the data.

You can drill up by either clicking on the vertical three-dot menu to the right of the arrow icon or by hovering over the graph and right-clicking to display the drill-up menu (note that drilling down is not possible using this method). Selecting 'Reset' in the same menu will return the graph to its initial state

(Quote:Looker Studio)
How to Use Drill-Down (Drill Actions) in Tables
This section explains how to use drill actions set up in table charts. When you hover the cursor over a dimension item, a drill-down menu will appear. Click on it to display more detailed information.

(Quote:Looker Studio)
- You can drill up and down using the arrows.
- When drilling up or down, you can choose whether to filter by that item.
- You can select which hierarchy level to display. While the arrows only allow you to move up or down one level at a time, here you can simply choose the level you want to display.
- A button is displayed that redirects to the specified URL.
Points to Note for Drill-Down Settings
Drill-down is not available on all components. For example, drill-down cannot be used on pivot tables or scorecards that do not have dimensions.

![[Looker Studio] How to Use Drill-Down | A Clear Explanation with Images](http://88studio.io/cdn/shop/articles/1280_x_450_px_33ce7464-6d2c-4424-a83d-b10d379ca0c1.png?v=1730982521&width=1100)
![GA4 Summary Report Template[4013]](http://88studio.io/cdn/shop/files/4013thumbnail.png?v=1733209235&width=533)
![GA4 Monthly Report Template[4007]](http://88studio.io/cdn/shop/files/4007_GA4-monthly-report-firstview_80551e9b-22ec-47d9-a375-29691372a34f.jpg?v=1702969299&width=533)
![GA4 EC Monthly Report Template[4008]](http://88studio.io/cdn/shop/files/4008_75c0c108-4e41-4fee-87ec-e7c823b6939d.png?v=1743466274&width=533)
![GA4 Standard Report Template[4004]](http://88studio.io/cdn/shop/files/4004_f67fd549-68fe-46c3-b8bc-57b0cad056ee.png?v=1740969729&width=533)
![GA4 EC Standard Report Template[4012]](http://88studio.io/cdn/shop/files/4012v2.0.png?v=1745371761&width=533)
![Google Ads Report Template[4003]](http://88studio.io/cdn/shop/files/4003_v2_1.png?v=1737458695&width=533)
![SEO Standard Report Template [4002]](http://88studio.io/cdn/shop/files/4002v2.0.png?v=1747814286&width=533)
![GA4 EC Basic Dashboard Template[4010]](http://88studio.io/cdn/shop/files/4010v2.0.png?v=1745966967&width=533)
![SEO Monthly Report Template[4011]](http://88studio.io/cdn/shop/files/4011_v2.png?v=1737028939&width=533)
![GA4 Dashboard Template[4009]](http://88studio.io/cdn/shop/files/4009v2.0.png?v=1740388404&width=533)